
IELTS THƯ ĐẶNG- TRUNG TÂM LUYỆN THI IELTS UY TÍN, CHẤT LƯỢNG TẠI HÀ NỘI
Tham khảo các bài liên quan:
>>> Kinh nghiệm luyện thi IELTS
>>> Hướng dẫn làm bài thi IELTS
SỬ DỤNG CÁC THÌ TƯƠNG LAI TRONG BÀI LINE GRAPHS VÀ BAR CHARTS
Trước đây IELTS Thư Đặng đã có series [ CÁCH VIẾT 7 DẠNG BÀI BIỂU ĐỒ TRONG WRITING TASK 1 – BÀI LINE GRAPH VÀ BAR CHART + PIE CHART]
Các bạn có thể tham khảo lại bài cũ:
1: CÁCH VIẾT DẠNG BÀI BIỂU ĐỒ TRONG WRITING TASK 1 " BÀI LINE GRAPH"
2: CÁCH VIẾT DẠNG BÀI BIỂU ĐỒ TRONG WRITING TASK 1 " BAR CHART + PIE CHART"
Tiếp theo series, IELTS Thư Đặng tới các bạn Các sử dụng thì tương lai trong bài Line Graphs và Bar Charts
Sử dụng thì tương lai trong bài line graphs và bar charts cho bài viết Academic
The future simple [ Tương lai đơn ]
Cho bài viết về dân số sẽ có xu hướng tăng
The population will increase
The future perfect [ Tương lai hoàn thành]
The population will have increased by 2020
Các cấu trúc áp dụng trong câu thì tương lai:
It is forecast(ed) / projected / estimated / anticipated / expected that the population will increase / the population will have increased by 2020
The population is forecast(ed) / projected / estimated / anticipated / expected to increase/ to have increased by 2020
…..The forecast(ed) / projected / estimated / anticipated population in 2020 is
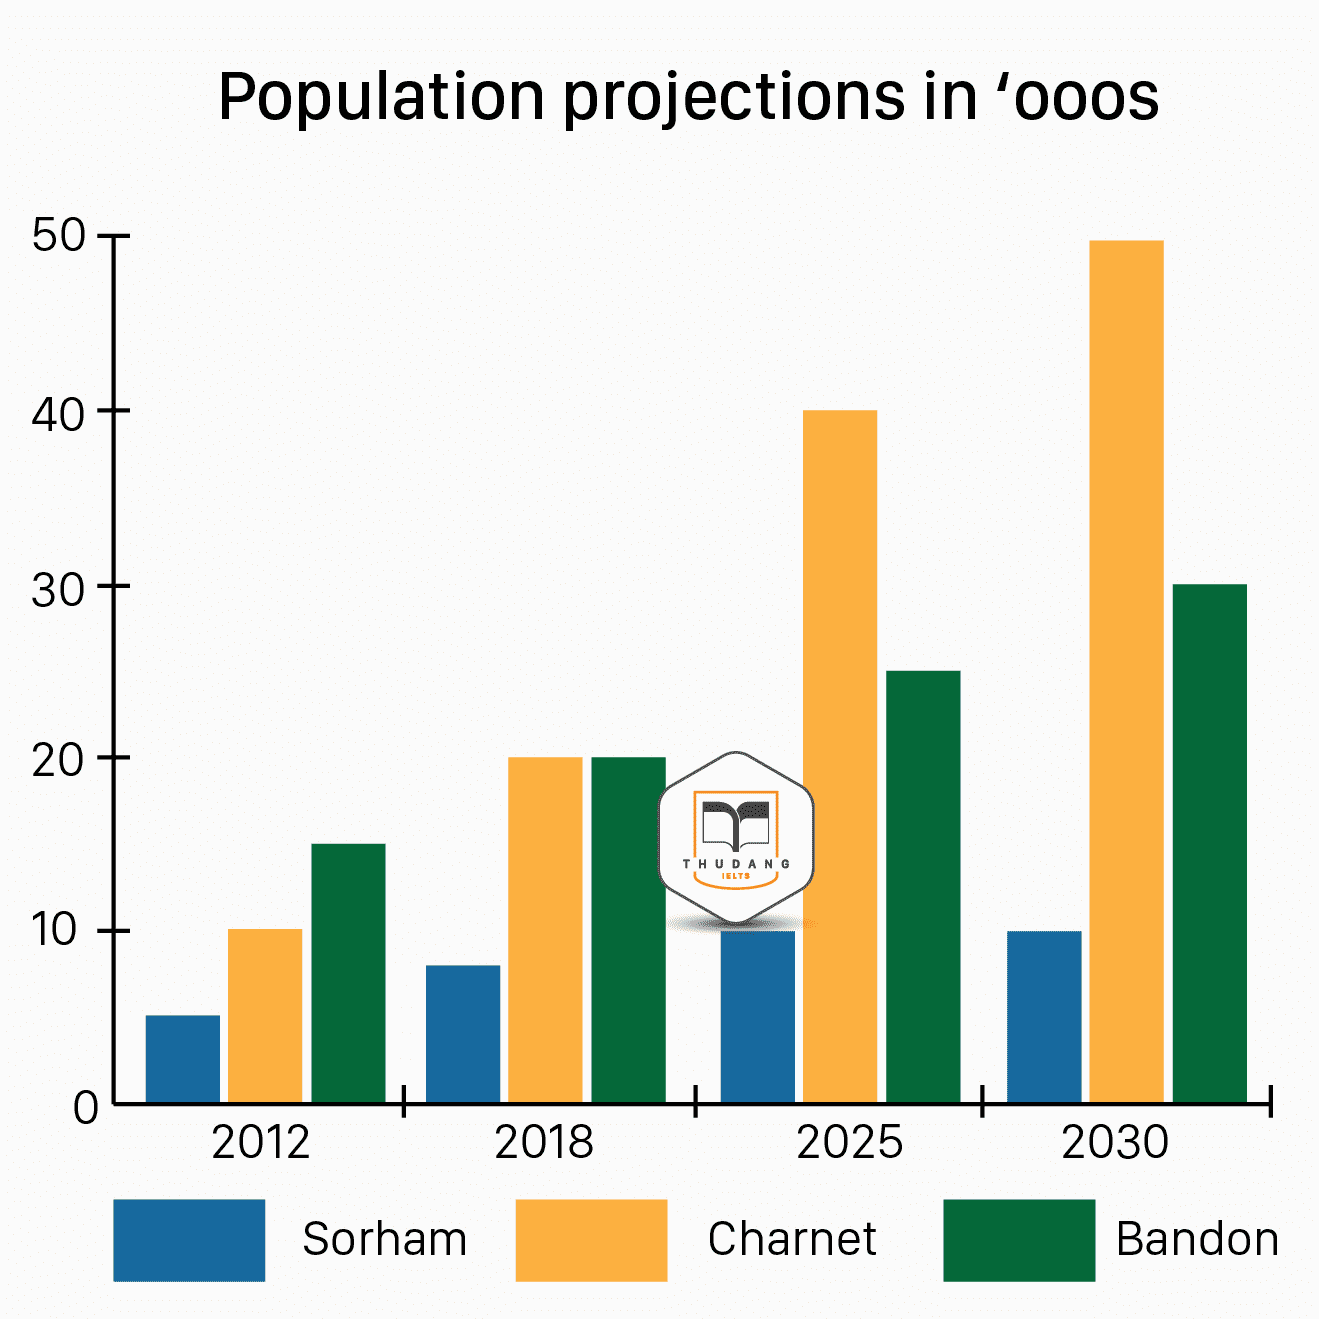
The chart below shows projections for the populations of three towns in three years up to 2030
Thực hành:
Summarize the information by selecting and reporting the main features, and make comparisons where relevant
Chọn phương án thay thế tốt nhất cho các phần được đánh dấu từ A đến B.
A. The population is 20,000
B. The projected growth in population
C. Will have grown much faster than the other two towns
D. The number of inhabitants is expected to rise
E. It is estimated that the population will have doubled
The graph shows N1. the estimated population growth in Sorham, Charnet and Bandon in 2012, 2018, 2025 and 2030
While N2. it is forecast that there will be a marginal rise in the number of inhabitants in Sorham in each of the four years, by 2030 N3. the population is estimated to double from approximately 5,000 inhabitants to 10,000. By contrast, Charnet N4. is expected to experience the fastest pace of growth, effectively quadrupling to 40,000 inhabitants by 2025 from 10,000 in 2012 and then growing by another 25% to 50,000 by 2030
In Bandon, the pattern of growth is set to mirror that of Charnet, although not quite at the same pace. By 2018, N5. the projected population is 20,000, an approximate increase from approximately 15,000 in 2012. Then, by 2030, it is forecast that the population will have risen to 30,000, effectively doubling the population over the period
Generally speaking, it is expected that there will be an overall increase in population in the three towns, though at a different pace of growth
Answers:
N1. B
N2. D
N3. E
N4. C
N5. A
IELTS Thư Đặng chúc bạn mọi điều tốt đẹp.
Chúc may mắn.
Trân trọng cảm ơn các bạn!
Ngoài ra các bạn có thể tham khảo thêm rất nhiều nguồn tài liệu khác ở các thư mục của Website:
IELTS - Thư Đặng Tổng hợp!
.png)
IELTS THƯ ĐẶNG CHÚC BẠN THI TỐT!
Thân mến,
IELTS THƯ ĐẶNG
 ĐĂNG KÝ KIỂM TRA ĐẦU VÀO - TƯ VẤN MIỄN PHÍ
.png)