
IELTS THƯ ĐẶNG- TRUNG TÂM LUYỆN THI IELTS UY TÍN, CHẤT LƯỢNG TẠI HÀ NỘI
Tham khảo các bài liên quan:
>>> Kinh nghiệm luyện thi IELTS
>>> Hướng dẫn làm bài thi IELTS
IELTS Writing Target 9 Band Essays is a Target 9 Band Essays samples to help you get familiarised with the format of IELTS Writing band 9 essays.
PART 3
21. The process shows diamonds moving from the mine to the retailer. Summarize the information by selecting and reporting the main features, and make comparisons where relevant.
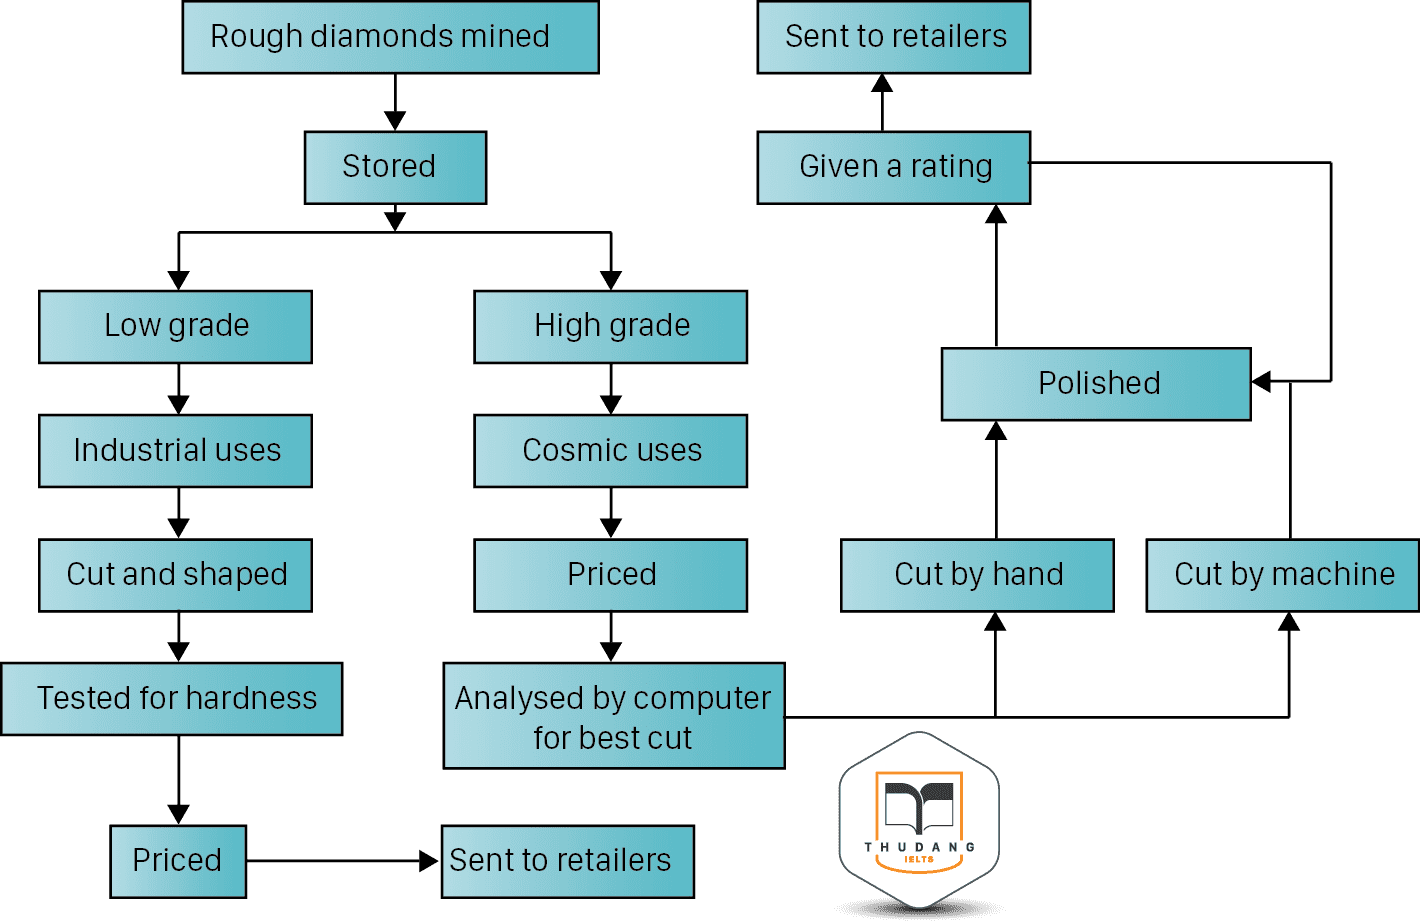
Sample answer: The given sequential diagram illustrates the steps involved in the process of getting diamonds from a mine to the ones who are selling them. Overall, it is clear that the mined rough diamonds are categorized according to their quality. Low grade diamonds are passed through less number of stages as compared to the high quality diamonds. To begin with, the diamonds are mined in their rough form following which they are stored and then sorted into two different grades namely, low grade and high grade. Low graded rough diamonds are set aside for industrial purposes, after which they are cut and shaped, then assessed for their level of hardness. The final step before being sent to the retailers is the pricing. On the contrary, the high graded rough diamonds are sent to the cosmic users where their prices are determined and analyzed digitally by the computer for the most effective cut. After analyzing they are either cut by hand or by machine before polishing. The polished diamonds are then rated and the best rated diamonds are sent to the retailers while the diamonds with low ratings are sent again for polishing to increase their rating for sale. |
22. The sequential diagram below shows the stages of processing cocoa beans. Write a report for a university lecturer describing the process below.
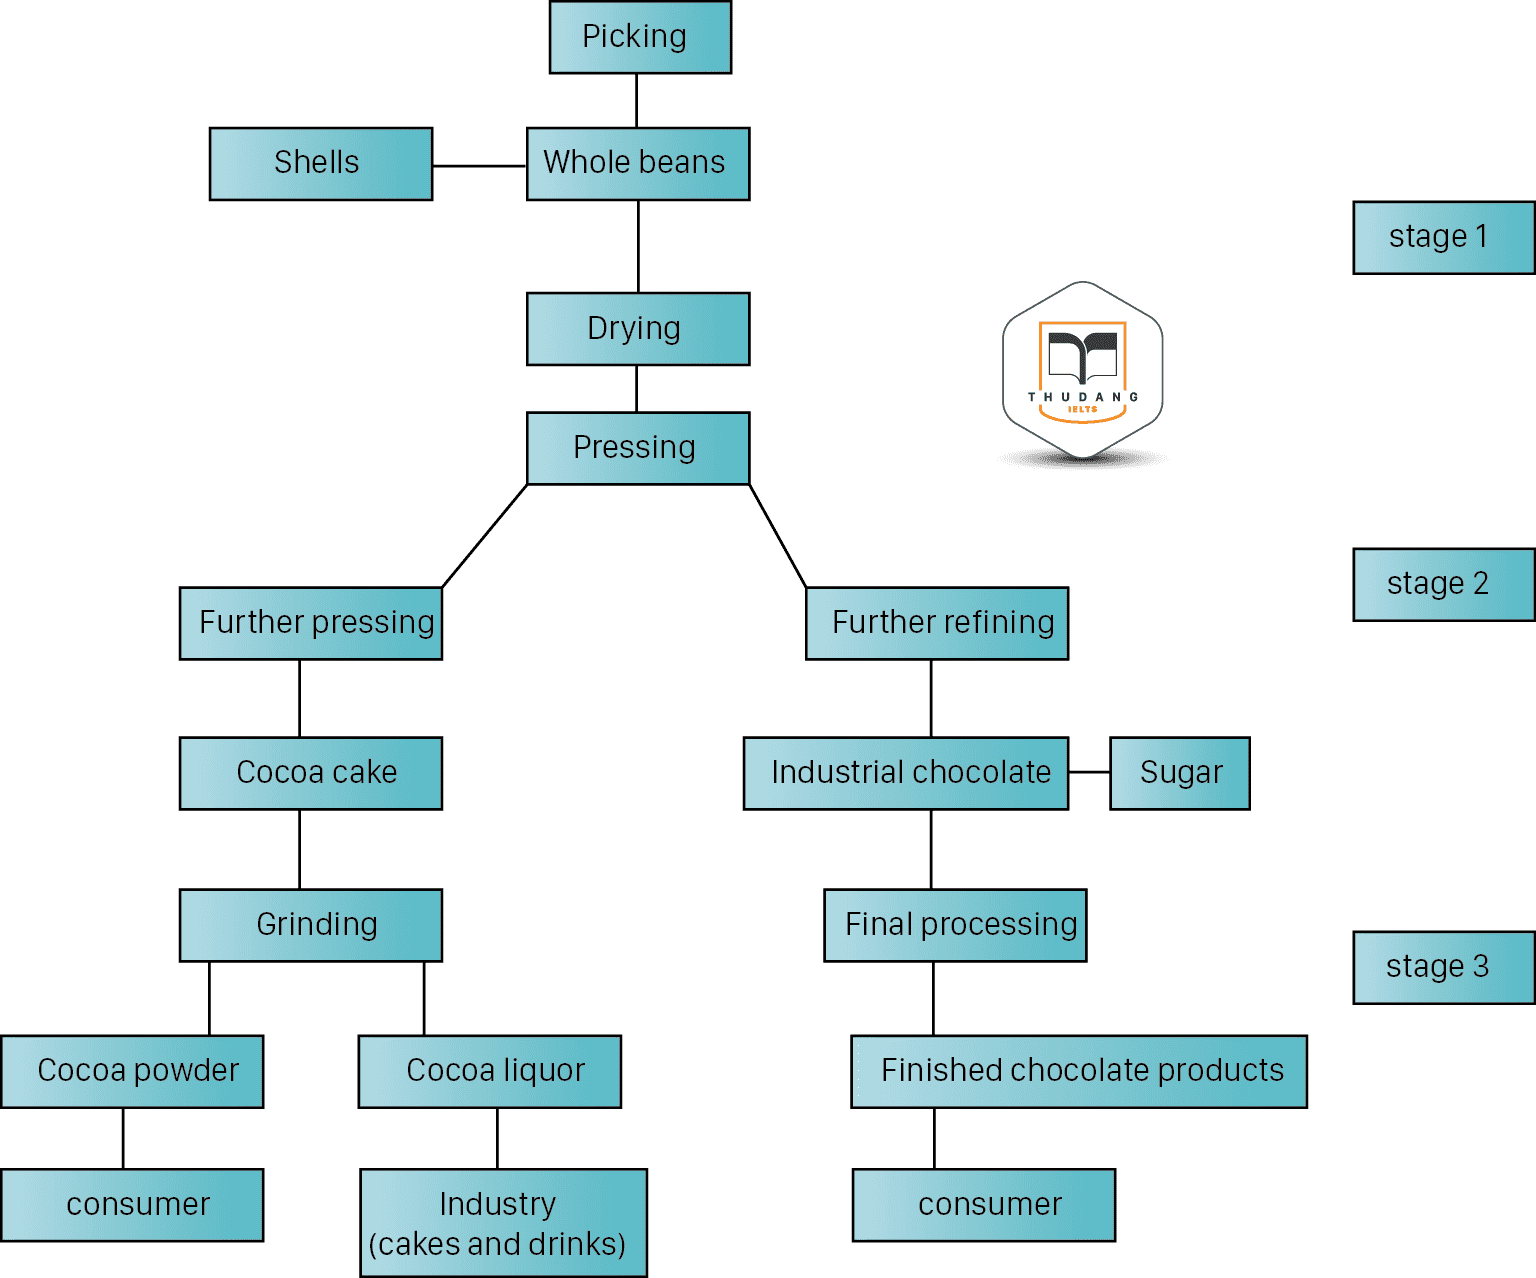
Sample answer: The given flow chart illustrates how cocoa beans are processed to obtain different products. Overall, it is clear that cocoa grain undergoes through various steps starting from whole beans to entering the market as final product. These include drying, pressing, refining, grinding and processing. In the first stage, the whole beans are picked from the cocoa tree. After being picked, their outer shells are removed and they are dried for the next stage. Stage 2 consists of many steps. Firstly, the dried beans are pressed. Some of these pressed beans are further pressed to make cocoa cake, whereas the rest are refined to make industrial chocolate to which sugar is added. In the third and final stage, the cocoa cake is ground to make cocoa powder and liquor is also obtained. The cocoa powder is sent to the market to be used by the consumer, whereas the cocoa liquor is used in the industry to make cakes and drinks. The industrial chocolate is sent for final processing after which the finished chocolate products are finally consumed by consumers. |
23. The sequential diagram below shows the steps in the hiring process at GCM Corporation. Summarize the information by selecting and reporting the main features, and make comparisons where relevant.

Sample answer: The flow chart shows the steps followed by the GCM corporation to recruit new employees. Overall, it is clear that the selection procedure seems to be quite hard due to certain assessment criteria's followed by interviews that a candidate has to pass in order to get a job offer. Application can be rejected at these stages if an applicant does not fulfill requisite conditions. The recruitment procedure starts by following the requisite selection criteria by GCM human resource department .The job advertisement is published in the local newspapers and then job applications are received from aspirants which are further categorized in two groups A and B. Candidates falling in A category are appropriate for the required job position whereas B applications are found inappropriate. Applications assigned under A category are sent for assessment. On getting positive response, applicants are invited for interview however candidates found against criteria are rejected and are informed with thanking email .This interview is followed by same procedure by selecting persons according to the assessment criteria and are invited for second interview. Candidates who pass this interview undergo though last assessment after which they are offered job and failed applicants are sent back home by thanking them for their interest for applying in GCM Corporation. |
24. The diagram below shows the route incoming calls make to an office supply company.

Sample answer: The given flowchart highlights the various stages involved when an office supply company deals with an incoming phone call. Overall, it is clear that a caller has to pass through certain extensions in order to get his problem solved. It is also noticeable that two main queries are resolved by the executives which are information about any new product or order placing and support regarding the existing or previous order. Initially, a phone is answered and the callers are offered assistance by asking what help they need. This may lead directly to the request to place an order or for product information. The customer’s name and company name are then taken before they are transferred to the sales section on extension 2203. The appropriate help is then given here. Alternatively, the caller may want help with an existing or previous order. The resolution is provided by the billing and shipping department, in case the query is related to them. If, however, the problem is with the product, then company details are taken and the call is transferred to extension 2217 where the customer is assisted at the help desk. |
25. The diagram illustrates how steel rods are manufactured in the furniture industry. Summarize the information by selecting and reporting the main features and make comparisons where relevant
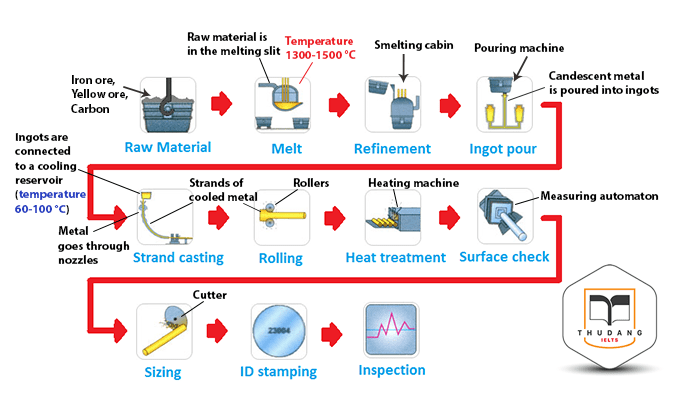
Sample answer: The diagram shows the process of steel rods production for the furniture industry. Overall, it is clear that the production process of steel rods is quite complex which requires range of apparatus. Temperature is also varied on certain stages. First of all, iron ore, yellow ore and carbon are collected to serve as a raw material for steel rods manufacturing. After that, the raw material is melted in a melting slit, where it is heated to a temperature in range of 1300-1500 °C. The melted mass is then transferred to a smelting cabin to undergo refinement. Next, the candescent metal is put in a pouring machine and poured into ingots. In the next stage, the ingots are connected to a cooling reservoir, where the temperature falls to 60-100 °C. Metal goes through special nozzles and cools down, forming strands. Following this, the metal strands proceed to rollers that change their shape. Next, the products are put into a heating machine, where they undergo heat treatment. Subsequently, a measuring completes a surface check of the products. After that, the metal rods are sized by special cutters and get ID stamping. Finally, the products undergo inspection and are ready for use. |
26. This pictures below show how tomato ketchup is made. Summarize the information by selecting and reporting the main features.
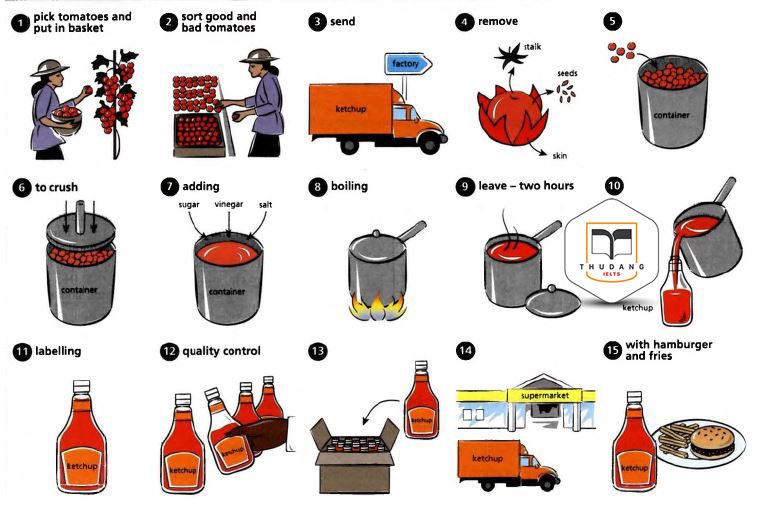
Sample answer: The diagram shows the 15 stages involved in the process of making tomato ketchup. Overall, it is clear that it is quite a lengthy process to produce bottles of tomato ketchup. Meanwhile, it requires a range of apparatus and also involves certain sub processes. In the first stage, tomatoes are picked and put in baskets. Then tomatoes are sorted according to their quality. After this, they are sent to the factory where stalk, seeds and skin are removed from tomatoes. Having been stored into the container, the processed tomatoes are crushed. In the next step, sugar, vinegar and salt are added, and this mixture is boiled in order to get a right temperature. After being left for two hours, the mixture is poured into the ketchup bottles and labeled as polished products. In the subsequent stages, only selected bottles are packed and delivered to supermarkets. Finally, the customers enjoy tomato ketchup with hamburger and fries. |
27. The diagram shows how apple is canned. Summarize the information by selecting and reporting the main features, and make comparisons where relevant.
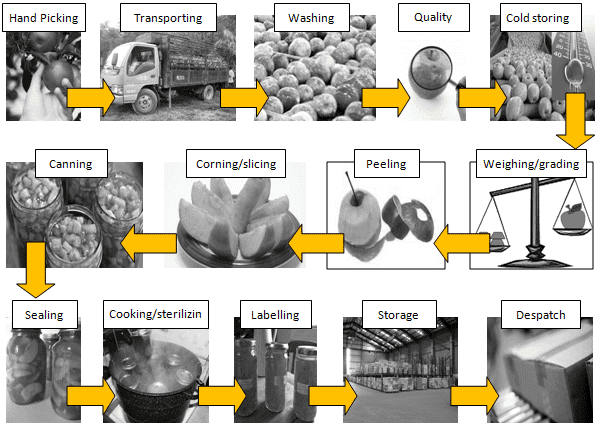
Sample answer: The diagram illustrates the process by which apple is preserved in cans. Overall, it is clear that canning process of apples seems to be quite lengthy. Also, there are certain sub processes involved from beginning to the dispatching of final product. In the first stage, apples are picked from plants by hand. They are then transported to the cannery with the help of large trucks. At the cannery the apples are washed and quality checked, and any poor quality apple is rejected. The good quality apples are kept at cold storage. Following this, they become ready for canning and are weighted and graded. The grading ensures that the apples of a similar size are kept together. After this, the apples are peeled and the cores are removed. They are then sliced into the required sizes and put into cans. Some kind of liquid or syrup is also added to the cans. Once the cans have been filled they are sealed and cooked over heat to ensure that the cans are sterilized. After cooling, a label is attached to them and they are placed into storage. The canned apples are now ready to be dispatched to supermarkets for sale. |
28. The diagram below shows how orange juice is produced.
Summarise the important information by selecting and reporting the main features, and make comparisons where relevant.
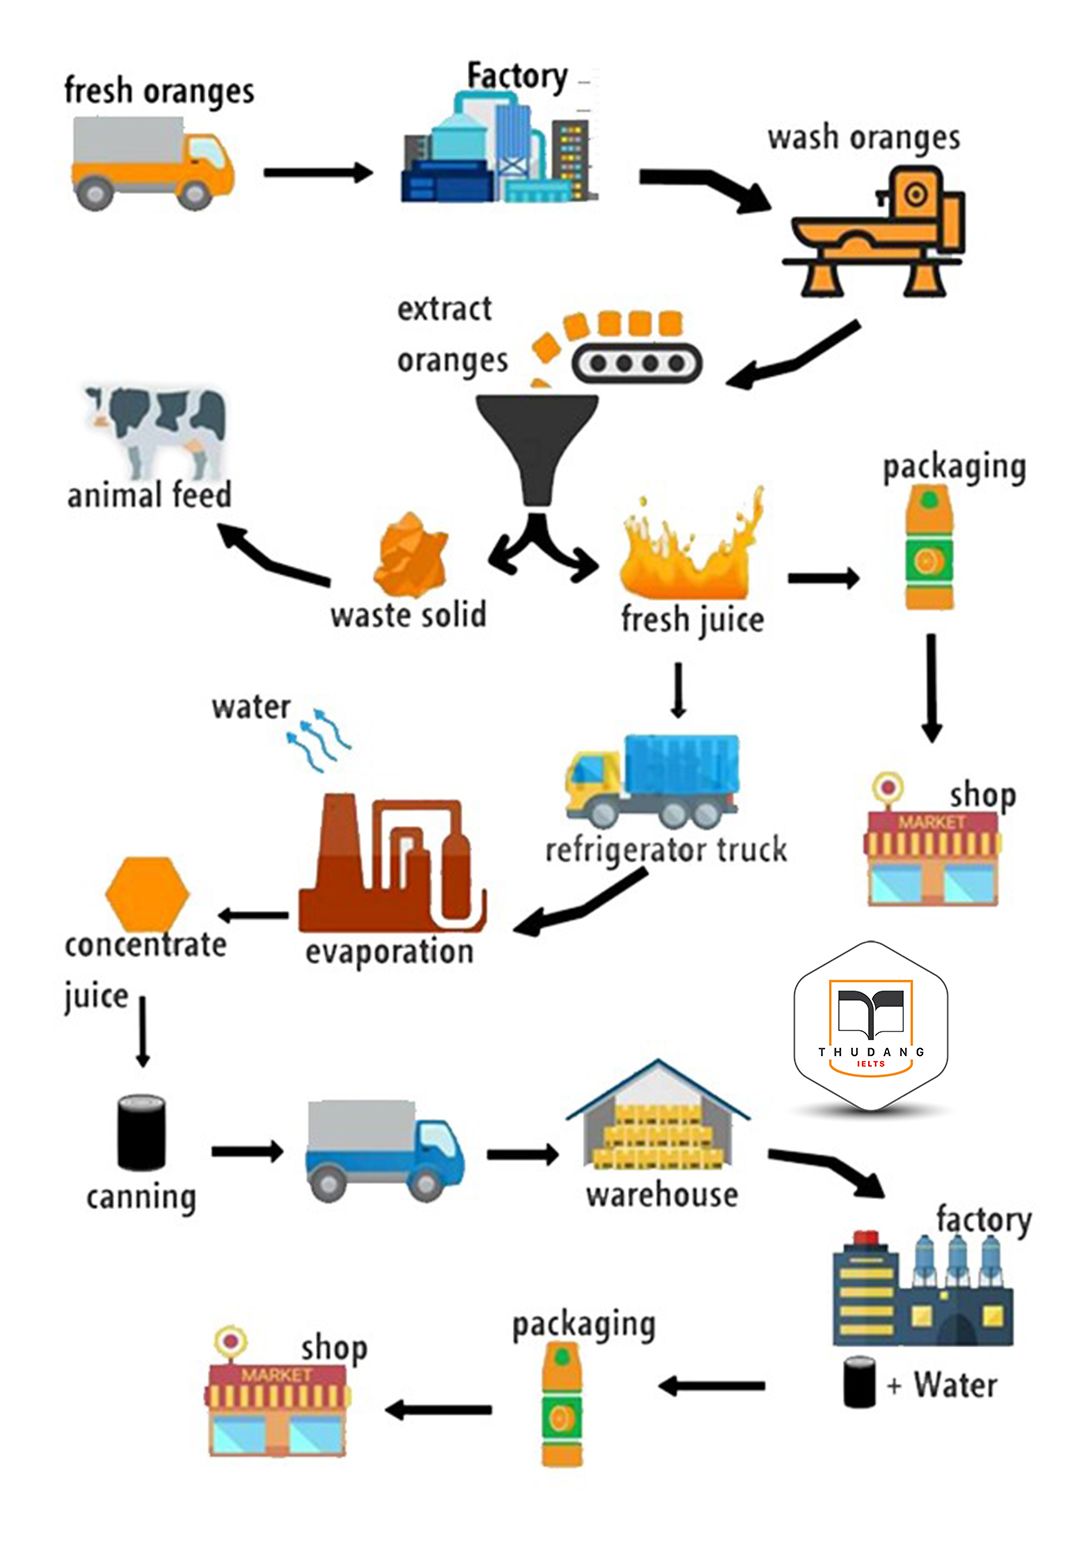
Sample answer: The diagram illustrates the linear process of producing fresh and concentrated orange juice for the purpose of selling in supermarkets. Overall, it is clear that the production process of fresh juice seems to be shorter as compared to the lengthy procedure of making concentrated juice. Also, the raw material remains common for making both kinds of juices. The process commences with fresh oranges being delivered to a factory, where the raw product is washed and juice is extracted with excess solid waste being used as animal feed. At this point in the process the fresh juice is either delivered in refrigerated trucks for evaporation or packaged and transported to supermarkets for selling to customers. After this, evaporation is carried out at a separate facility, removing water and resulting in the production of concentrated orange juice, which is subsequently canned and stored in a warehouse. As required, the orange concentrate is then processed in a third and final plant, where it is mixed with water in order to produce reconstituted orange juice, which is then packaged and ultimately delivered to supermarkets. |
29. The diagram below shows how geothermal energy is used to produce electricity. Summarize the information by selecting and reporting the main features, and make comparisons where relevant.
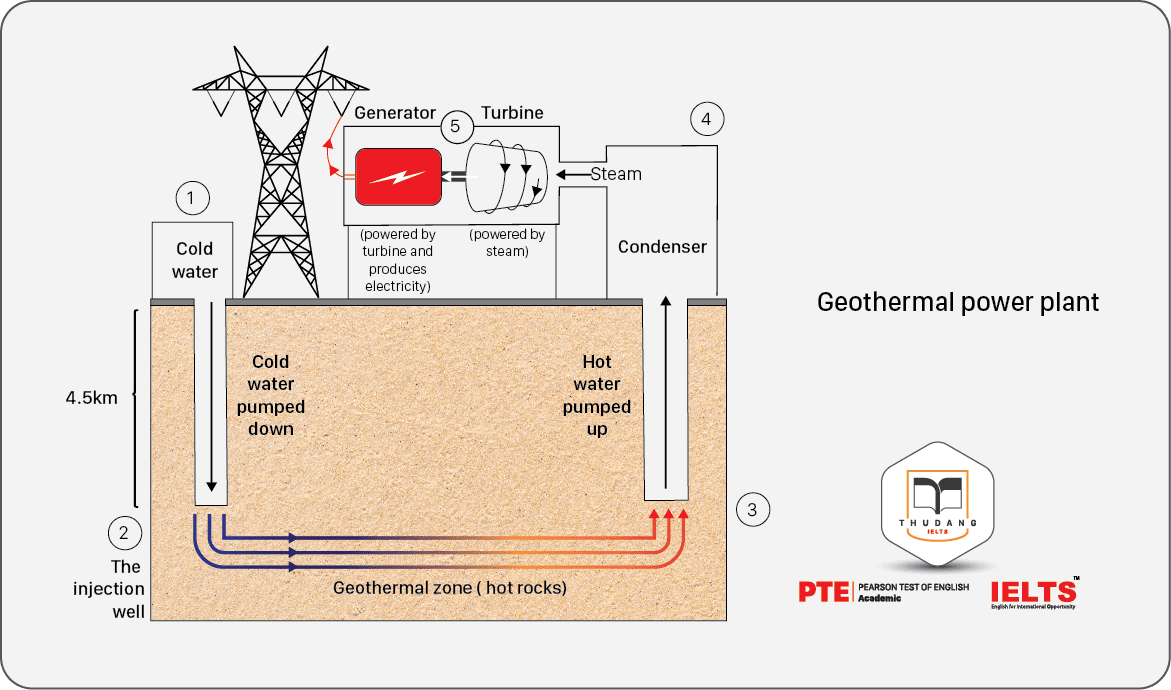
Sample answer: The diagram illustrates the process by which geothermal energy is used in the production of electricity. Overall, it is clear that electrical output is directly proportional to the geothermal energy .It is also noticeable that water is circulated through the hot rocks beneath the surface of earth for the production of steam which is further responsible for the production of electricity. In the first stage, cold water is pumped down 4.5 km underground through the injection well. Next, the water is injected into the geothermal zone, where hot rocks heat the water up as it passes through the Earth. Once the water has been heated up, it enters the production well and is then pumped up to the ground and into the condenser. The last two stages are carried out above ground at the power plant. First of all, steam is produced from the hot water in the condenser. In the following step, the steam passes into the turbine and makes it spin. Finally, the generator, which is powered by the turbine, produces electricity where it is then transferred into the electric grid via power lines. |
30.The diagram shows how a dredging boat will be used to keep the canals in Venice clear of mud. Summarize the information by selecting and reporting the main features, and make comparisons where relevant.
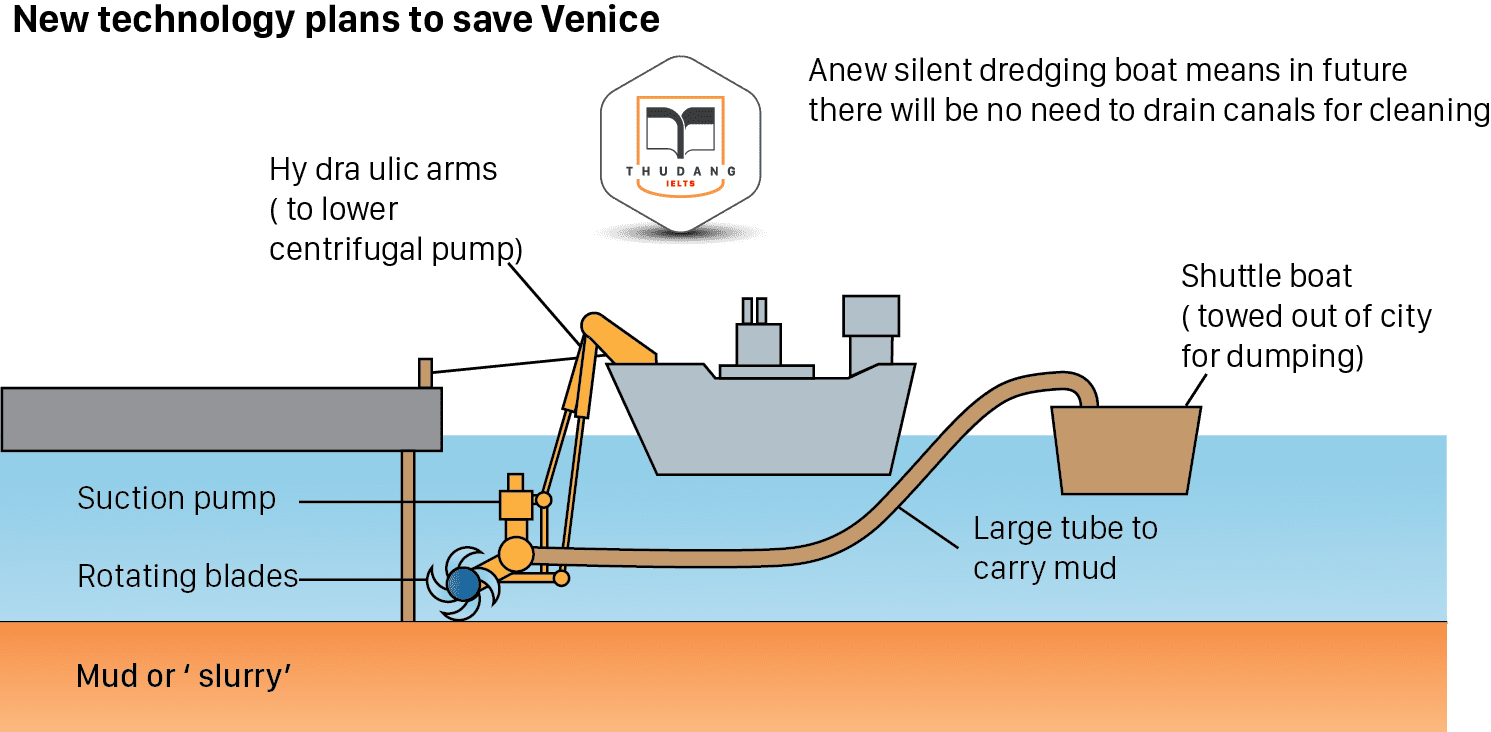
Sample answer: The picture shows a new dredging boat that will be used to dig up the mud from canals in Venice. Overall, it can be clearly seen that a dredger will be used in order to extract the slurry from its beneath. Also, the dredging boat will provide Venice with an effective means of keeping its canals clean, without having to drain them. The canal dredger would have four major functional units and one connecting unit. The entire system of canal dredger will be supported and deployed on a noiseless boat. The boat will have two hydraulic arms, which are planned to connect with a centrifugal pump and rotor blades. There will be a long tube connecting the pump to a large container called a ‘shuttle boat’. Operating the dredging boat is going to be a simple procedure. First of all, the hydraulic arms will be lowered until the rotating blades reach the mud below. Then, the blades would turn the mud into slurry. This will then be sucked up by the pump. It will pass through the long tube and into the shuttle boat. Finally, the shuttle boat is planned to be towed out of Venice and the mud and slurry will be dumped. |
31. The diagrams below show the cutting tools used by man 1.4 million years ago and 80,000 years ago. Summarize the information by selecting and reporting the main features, and make comparisons where relevant.
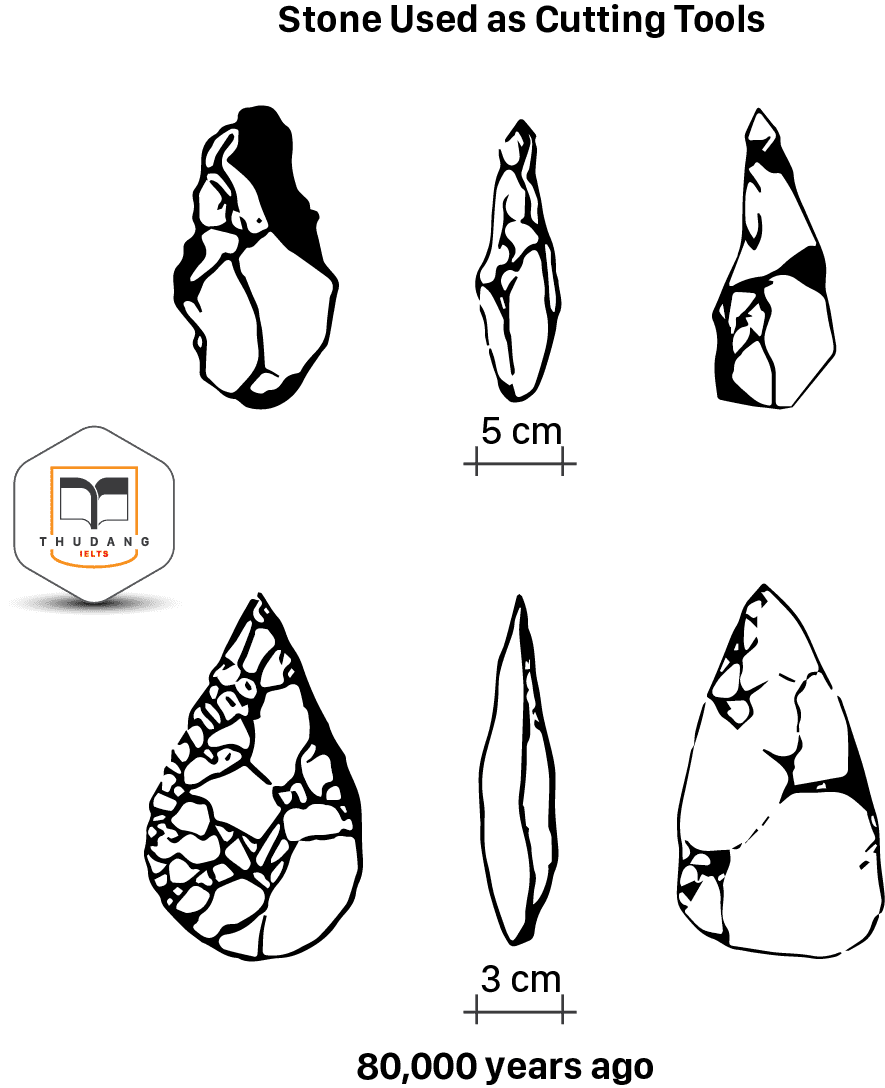
Sample answer: The diagrams illustrate two types of stone cutting tools from three viewpoints which are crafted by early man 1.4 million years ago and 80,000 years ago. Overall, the shape of the stones was similar in both periods but the tools from the later period were sharper, slimmer and made with more precision. Moreover, it shows the development of early man’s skills over the years. The stone cutting tools 1.4 million years ago were an irregular leaf shape with a base which measured 5 cm and narrowed at the tip. The tip, although pointed was not sharp but blunt due to the lack of precision in making the tools. The side view shows that the tool was wider in the middle, with a diameter of around 3 cm. The back of the stone had fewer cuts than the front and they were also not very fine. 80,000 years ago, man had developed better skills and had perfected the cutting tool. In the front and the back view it can be seen that the maximum diameter of the tool was the same as in the older tool. The sides of the tool were smoother and the tip of the tool was sharp, making it a more effective cutting tool. |
32. The diagrams below show some principles of house design for cool and for warm climates. Summarize the information by selecting and reporting the main features, and make comparisons where relevant.
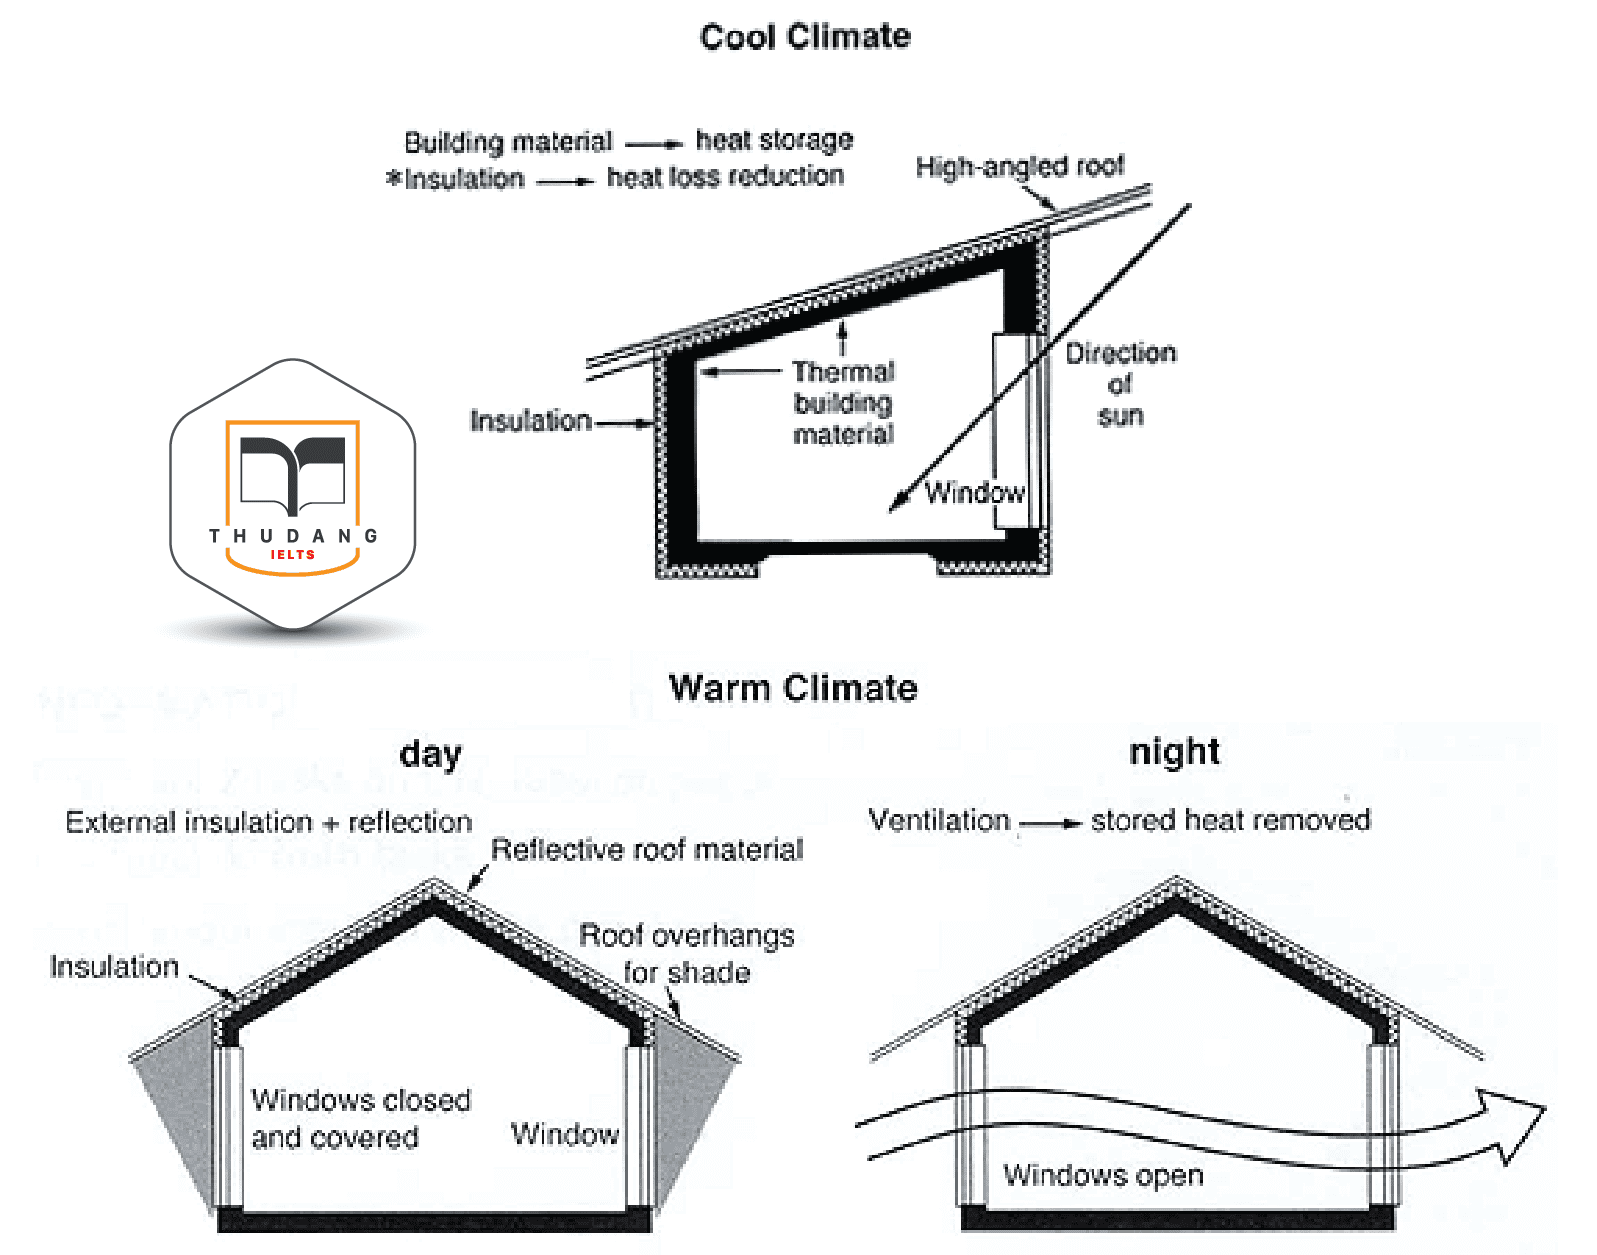
Sample answer: The given diagrams show a comparison between 2 designs of houses in terms of different climatic conditions Overall, it can be clearly seen there are substantial differences in the planning of both the houses. The main differences between both designs are related mainly to the roofs, windows and insulation. The house roof in cool climate is high angled, however, in cold weather, the house roof is made of reflective material. In addition, the entire wall of the house in cold climate is constructed from thermal building material surrounded by insulation, that keep house warm .On the other hand the insulation in warm weather is external insulation restricted to the roof of the house and extended in both direction to make roof overhangs for shade. The other difference is the design of the windows, as there is only one window located in the higher side wall of the house in cool areas. The window face the direction of the sun to allow invasion of sun light into the house. However, the design for house in warm place has 2 windows in both sides which are closed and covered in day time and opened at night to allow ventilation and remove the stored heat. |
33. The maps below show the changes that have taken place at the seaside resort of Templeton between 1990 and 2005.Summarize the information by selecting and reporting the main features , and make comparisons where relevant.
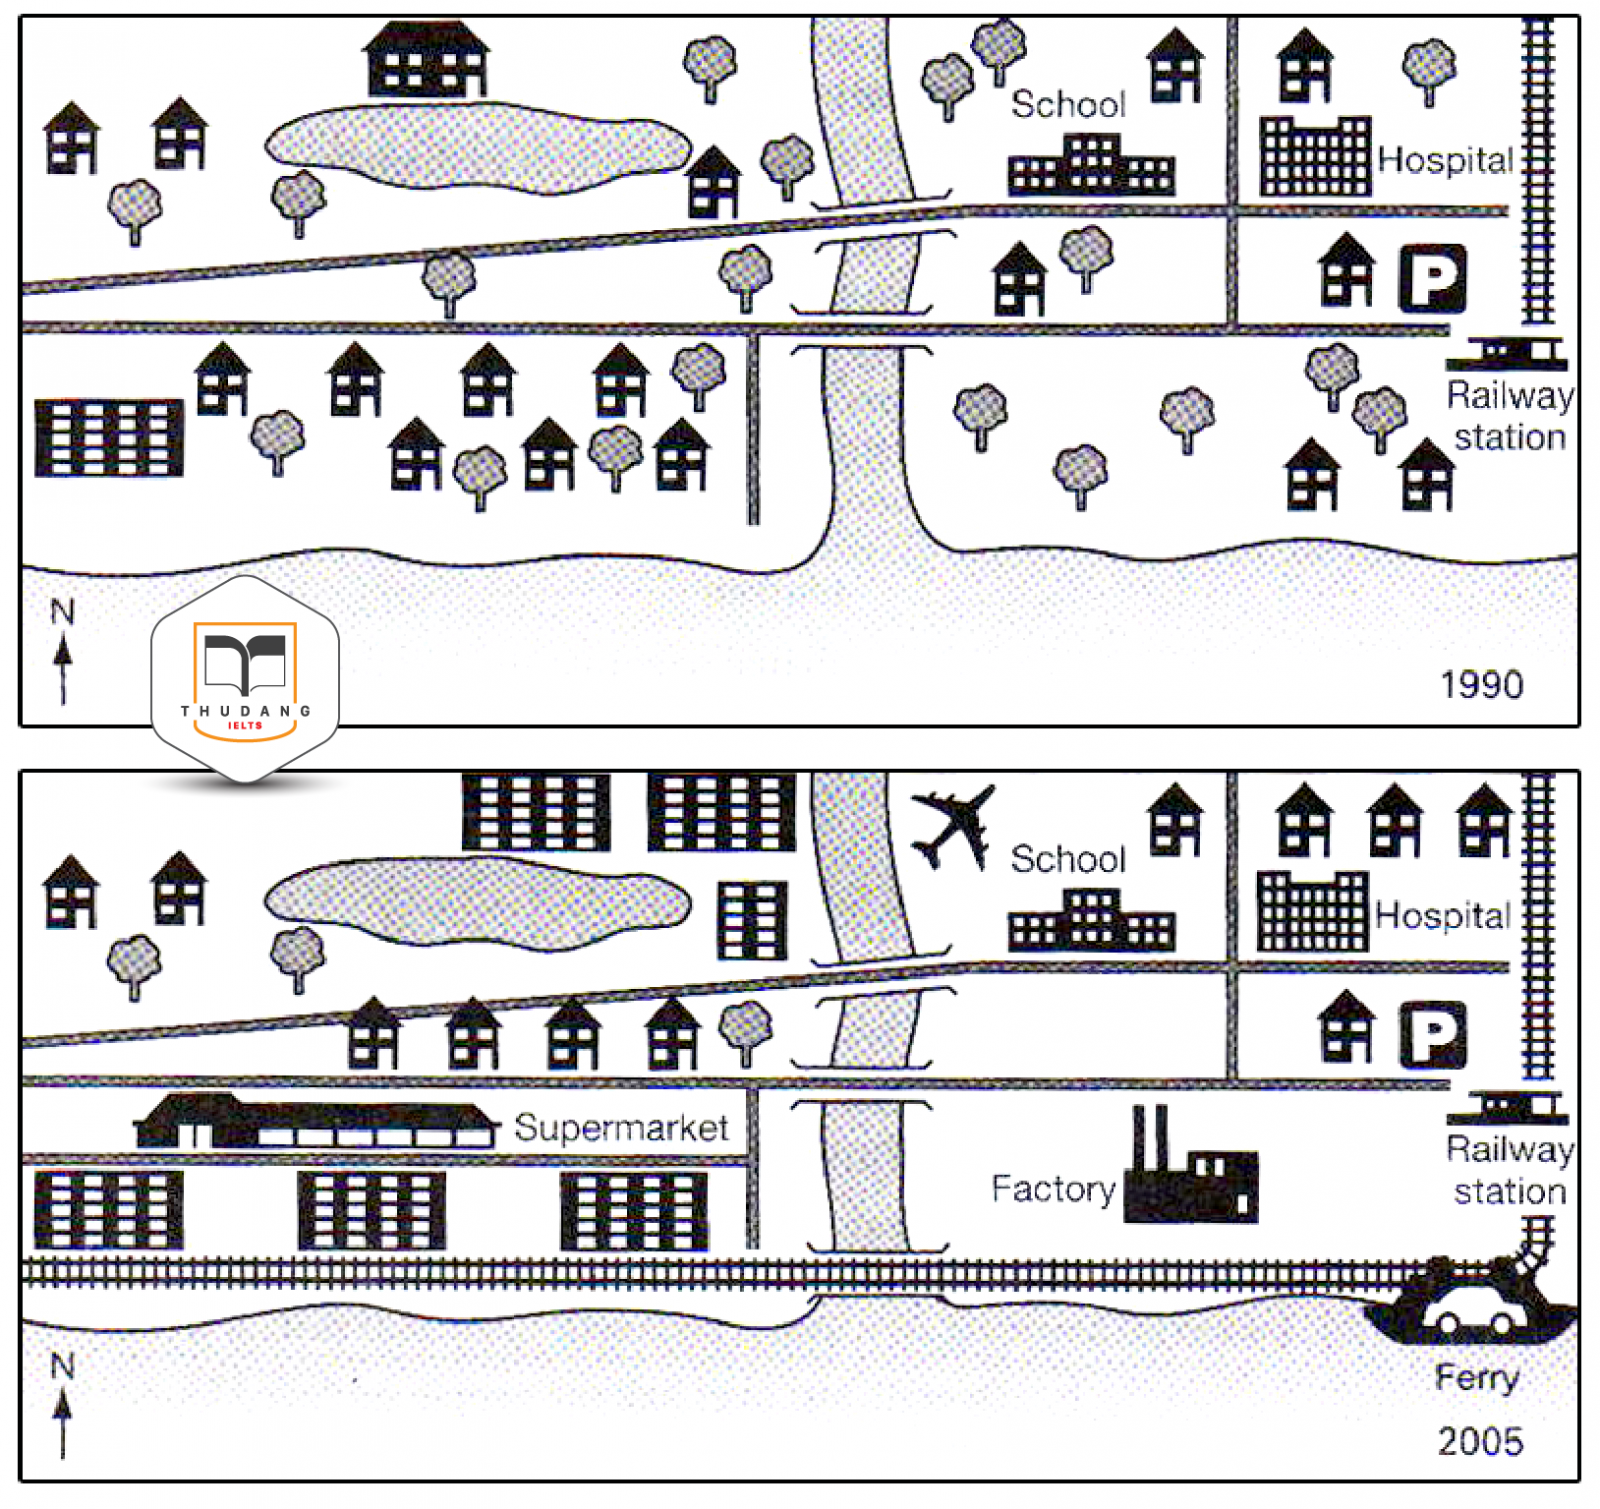
Sample answer: The maps illustrate what happened in the coastal vacation place of Templeton during the fifteen-year period, from 1990 to 2005. Overall , it can be seen that, this place had developed and become more industrial over the given period. Various public transports were introduced with the extension of railways and road. According to the maps, in 1990 seaside resort of Templeton was quite, natural, undeveloped place with many trees, housing estates and public facilities such as school, hospital and railway station, while by 2005 it had experienced significant changes. First of all, the trees were cut down and the new airport was constructed on the right side of the river, which run from the south of the city to the north and divides it into two parts. Moreover, the trees and houses located in the south-east part of the area were also pulled down to make way for a factory. Another striking change was expansion of residential area on the left side of the river, around the lake. The same developments took place in the south-west of the map, where new apartment blocks had been built. An interesting development had been the introduction of big supermarket which is to the north of the apartments. Another notable modification was extension of railway along the coastline. Furthermore, in 2005 the sea had been used for transportation of cars as well. Finally, the new housing area had been settled between the two roads running from west to east of the seaside resort of Templeton.
|
34. The map below shows three proposed sites for a new hypermarket (A, B and C) in the city of Pellington. Summarize the information by selecting and reporting the main features and making comparisons where relevant. Write at least 150 words.
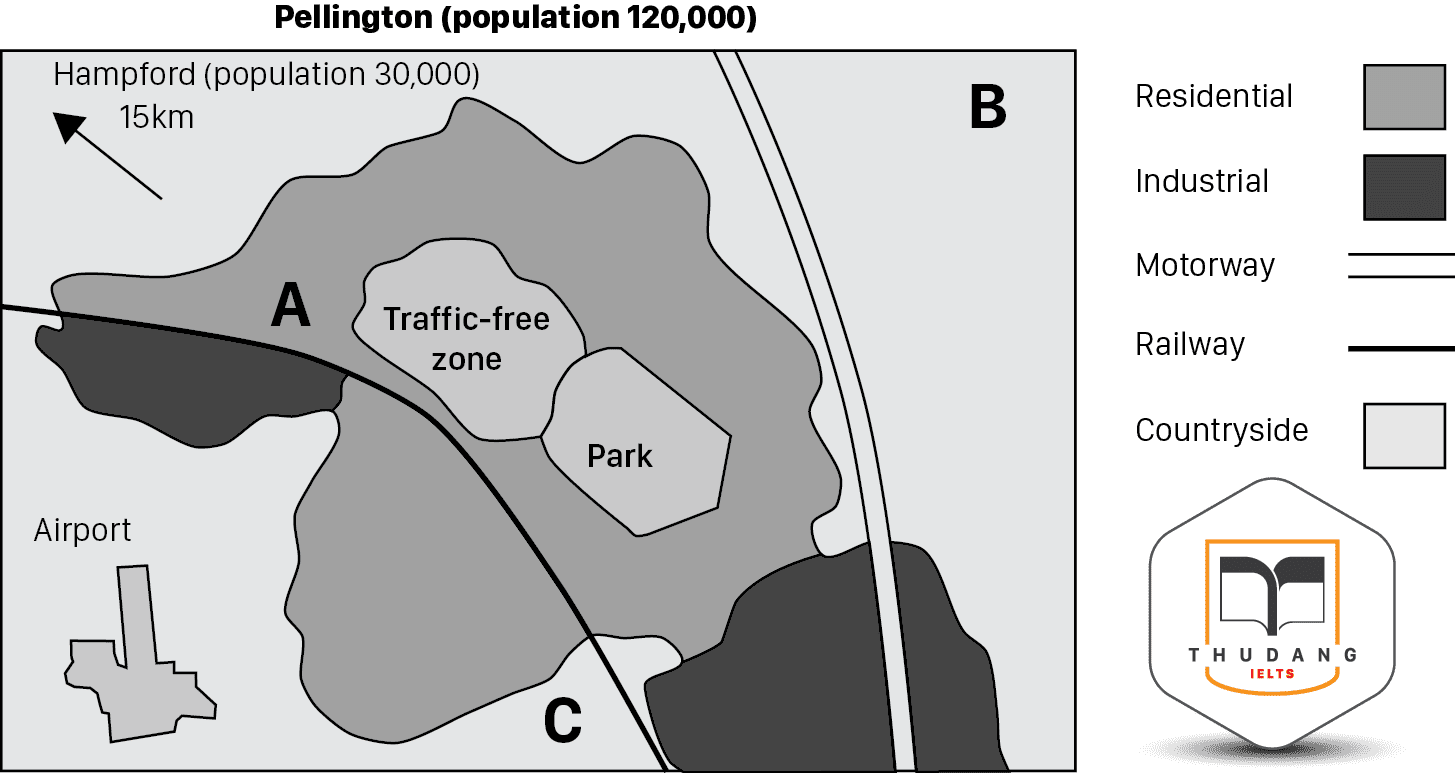
Sample answer: The map below illustrates three main possible sites for the new hypermarket in the city of Pellington. Overall, it is clear that all the three sites are proposed to build within the city as well as in the suburbs of the Pellington. It is also noticeable that site A and C would be more accessible comparing to site B which looks far away from the town. To begin with, focusing at site A, which is planned to construct within the city in the vicinity of no traffic zone. This location would be in the residential area and near to the industrial region in the west direction of the city Pellington. A railway line also passes close to it which separates the smaller industrial area from the residential region. Also Hamford town with having population 30,000 is located in the north-west direction of this proposed site. Moving to the site B, it is planned to construct in the north-east direction which is quite far from the main city and is separated by a motorway. The last proposed location for new hypermarket is site C which may be built in the south direction and very close to the railway line and bigger industrial area. Interestingly, airport can also be seen at around same distance between both the planned sites A and C. |
35. The maps below show the changes that have taken place at Liverpool John Moore's University from 2010 to present. Summarize the information by selecting and reporting the main features, and make comparisons where relevant.
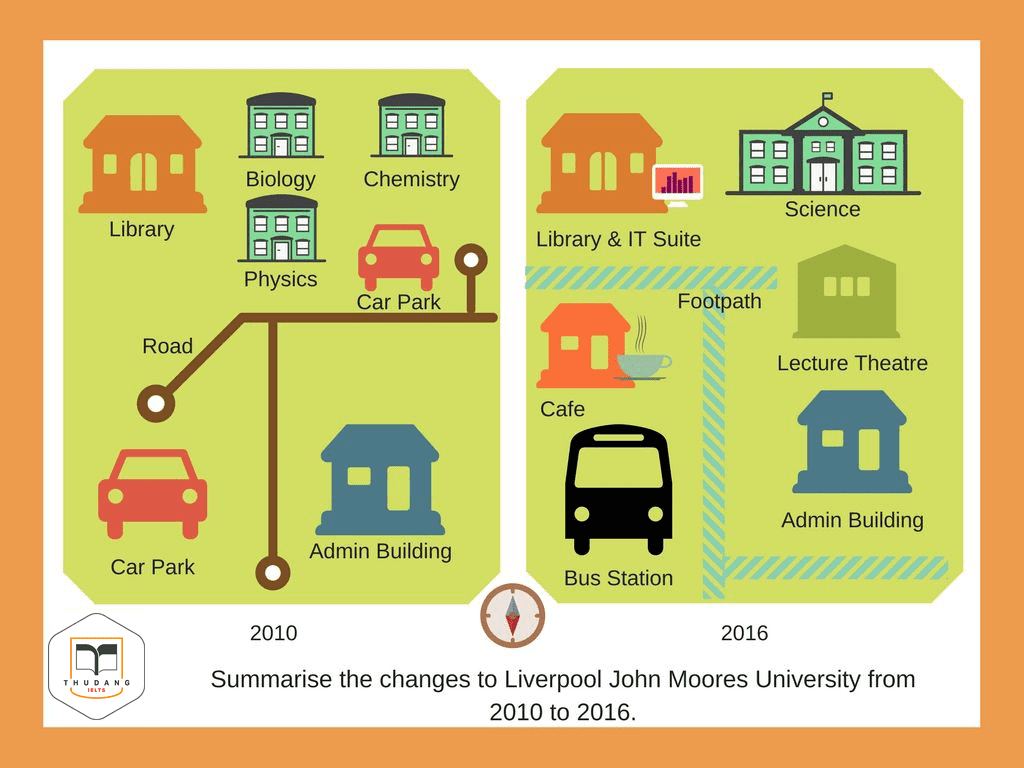
Sample answer: The maps illustrate the modifications that took place in the Liverpool John Moore’s university between 2010 and present. Overall , it can be seen that, since 2010, all of the buildings of the university campus have changed. There are quite a few improvements to both the buildings and access. According to the maps, over the period of 2010 to present, the area has gradually changed and many buildings have been modified. The library in the north-west of the campus has been renovated to include IT facilities. There were three separate blocks of science named physics, chemistry and biology in the north east direction of John Moore’s university in 2010 which have been demolished and replaced with one large science block. Another striking change was that the cark park on the eastern side has been removed to make way for a brand new lecture theatre at its place. The road with the help of which all the buildings were connected has been converted in a footpath. The admin block on the south-east side has been made smaller, to allow better footpath access. Finally, the large car park in the south-west direction of the campus has been transformed into a bus station. |
36. The diagram shows the life cycle of a monarch butterfly.
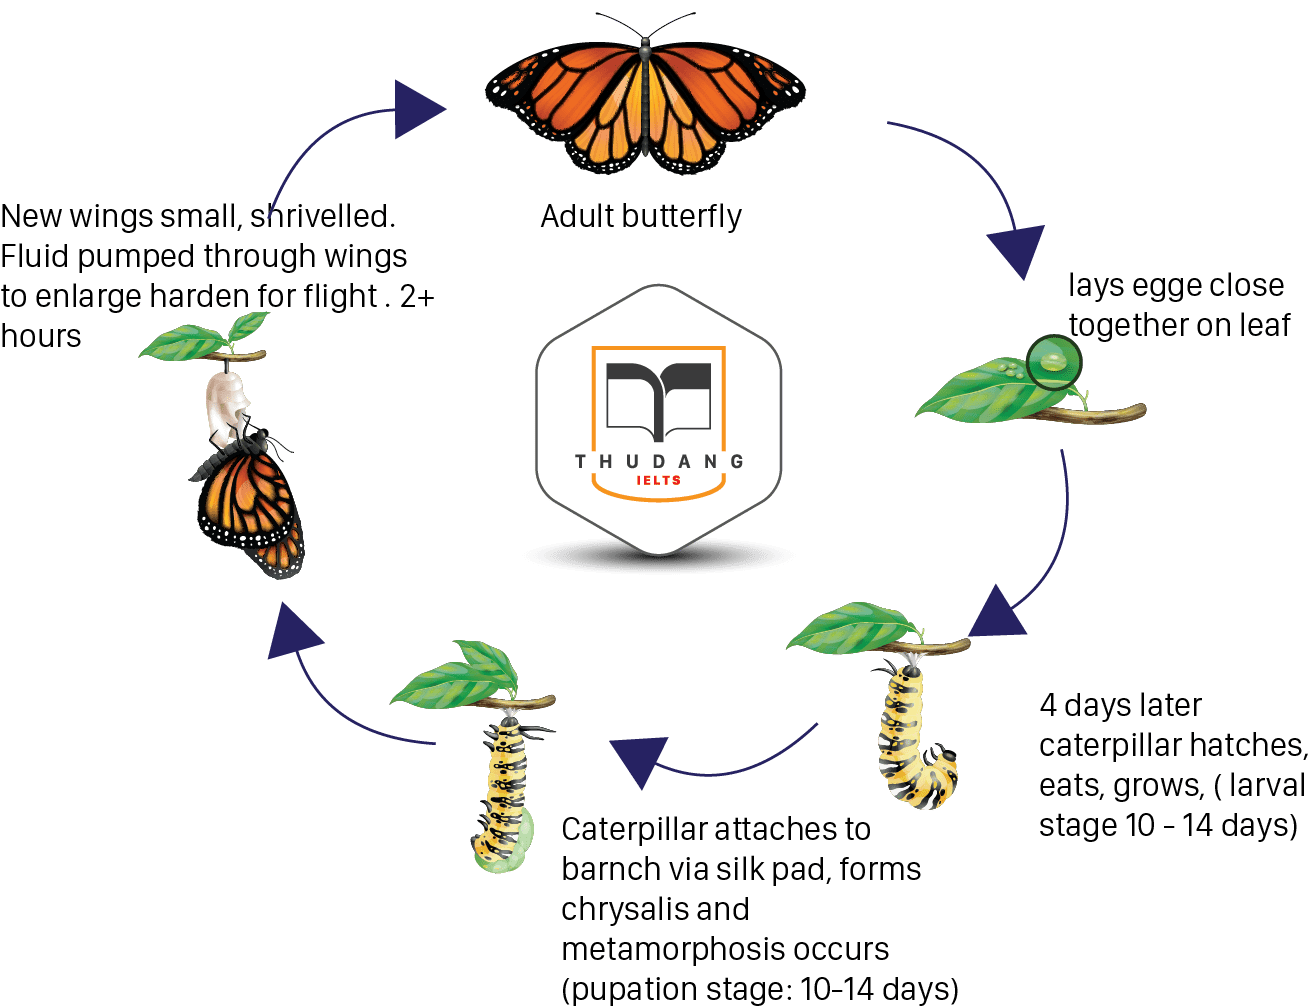
Sample answer: The diagram shows the stages through which a monarch butterfly undergoes during its entire life span. Overall, it is clear that the complete life cycle lasts between 24 and 32 days. It is also noticeable that there are five main stages in the development of the monarch butterfly, from egg to mature adult insect. The adult butterfly lays its eggs on a leaf, quite close together. After about four days the eggs hatch into caterpillars. This is known as the larval stage. Over the next two weeks the caterpillars eat in order to grow so that they can enter the next stage of the cycle. This is called the pupation stage. It is when metamorphosis occurs. The caterpillar finds a branch and attaches itself via a silk pad. It then forms a chrysalis around its body and inside this chrysalis it changes into a butterfly. This takes between ten to fourteen days. Finally, the butterfly emerges from the chrysalis, but its wings are too small and shrivelled to fly so it has to wait while fluid is pumped into the wings through the veins so as to enlarge and harden the wings for flight. This can take more than two hours. Once the butterfly is capable of flight it can reproduce, and the cycle will start again. |
37. The diagram below shows the life cycle of a frog. Summarize the information by selecting and reporting the main features and make comparisons where relevant.
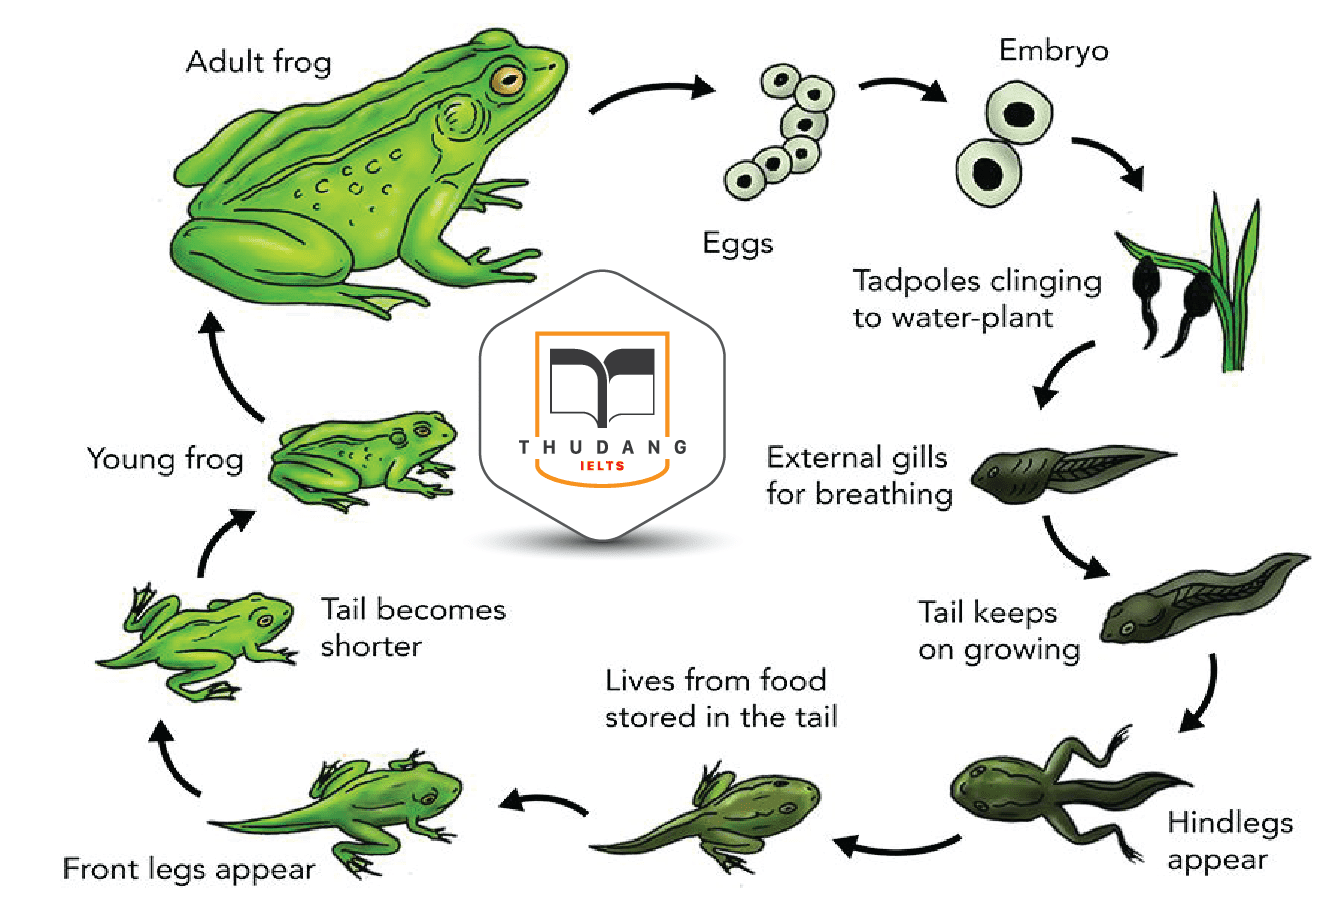
Sample answer: The diagram illustrates the different stages in the life of a frog. Overall, it is clear that tadpoles, which emerge from eggs in the water pass through many phases before going on to land and maturing into adult frog. It is also noticeable that the frog witnesses certain physical changes in terms of color and shape over the course of its life. In the first stage, eggs are laid by an adult female frog in large numbers. After this, they hatch and embryo emerges out of them and turns into tadpoles clinging to the water plants. A tadpole uses its external gills to breath and in the meantime its tail keeps growing. During the next stage hindlegs starts to appear within few days. In the following stage, the tadpole uses food stored in its tail for survival. Few days later the front legs start to appear and the length of the tail reduces. In the next stage tadpole turns into a young frog. Finally, after some time it grows and becomes a fully grown mature frog which is capable enough to lay eggs. Then, cycle starts again. |
38. The diagram shows the rock cycle. Write a report to university to the university lecturer.
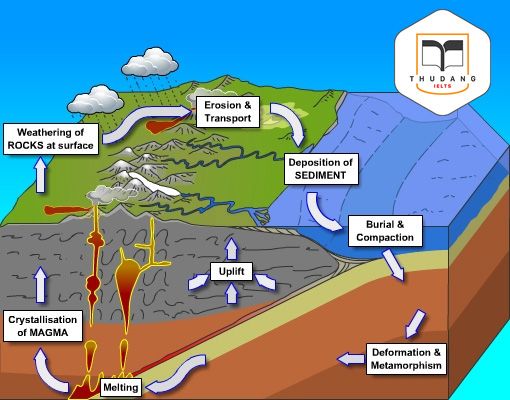
Sample answer: The diagram shows the how different kinds of rocks form in nature. Overall, it is clear that the rock cycle constitutes a series of slow changes which are unpredictable, invisible and constant. It is also noticeable that formation of three main types of rocks is involved in the rock cycle which are igneous rock, sedimentary rock and metamorphic rock. The rock cycle starts when magma crystallizes to form igneous rocks. The process of uplifting continues inside the igneous rocks due to upward and downward forces. After this, on earth’s surface, wind and water breaks these rocks into pieces and also carries them to another place by weathering and erosion. Usually, the rock pieces called sediments deposit to form a layer. This layer buries under other layers of sediments and after long time this compaction of various layers then leads to the formation of sedimentary rock. After the conversion of igneous rocks into sedimentary rocks, next phase starts where this rock changes its shape due to the heat and pressure produced inside the surface of earth. Due to deformation of the rock, the composition of the rock alters and it is termed as metamorphism which in turn gives rise to the formation of final type of rock known as metamorphic. In the final stage, again due to the heat produced from the movement of tectonic plates inside the earth, metamorphic rock gets converted into lava and the cycle repeats itself. |
39. The diagram below shows the nitrogen cycle. Write a report to the university lecturer.
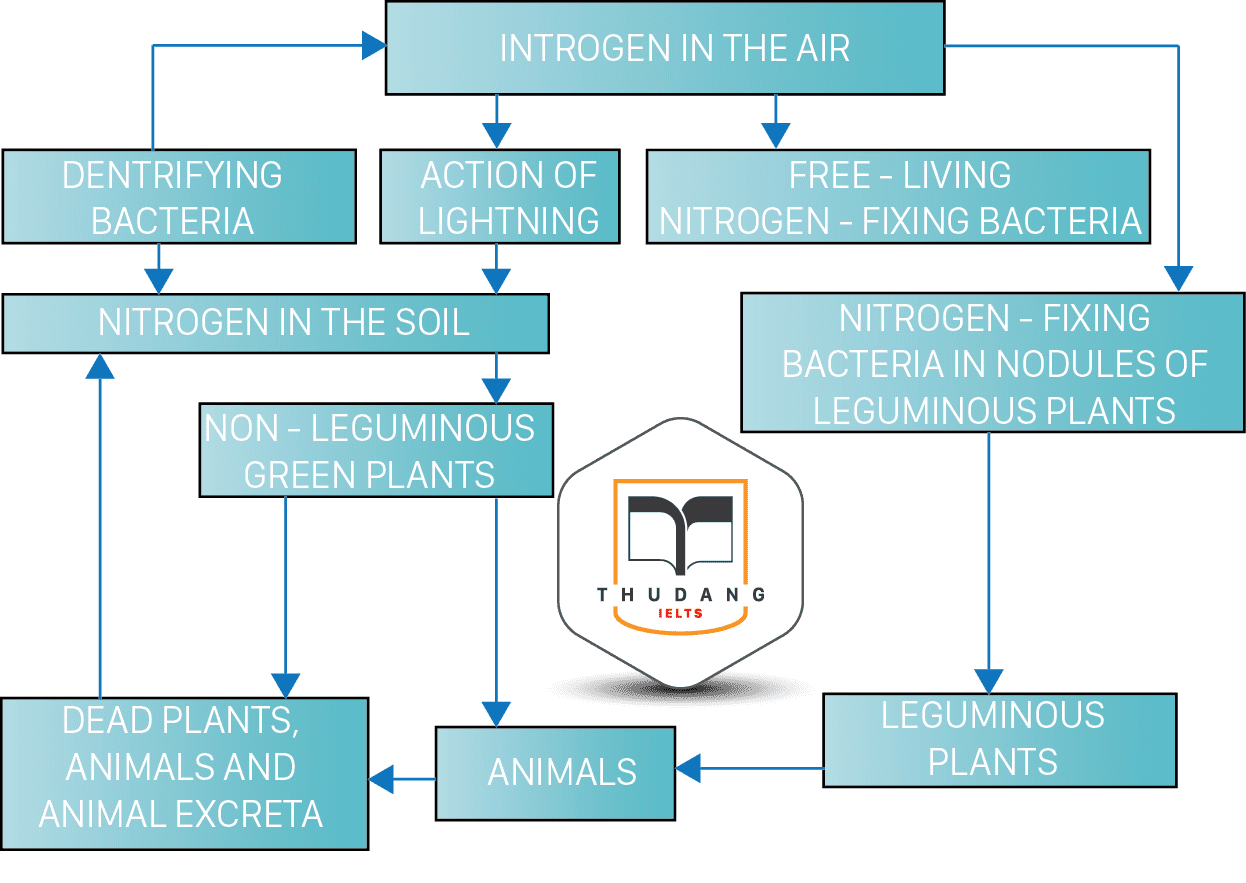
Sample answer: The diagram shows how nitrogen moves through different stages in the nature. Overall , it is clear that nitrogen cycle is the re-circulation and re-use of nitrogen in various forms to meet the demand for various environmental and biological activities. Also, the micro-organisms such as bacteria plays an important part in the completion of nitrogen cycle. The nitrogen cycle starts with the nitrogen present in the air. Nitrogen moves in a cycle through the air, plants and animals and the soil, and back into air. The action of lighting and free-living nitrogen-fixing bacteria carries the nitrogen into the soil. At the same time some nitrogen-fixing bacteria in the nodules of leguminous plants take the nitrogen directly from the air. The nitrogen in the soil is taken up by non-leguminous green plants, while leguminous plants derive nitrogen directly from the bacteria in the nodules. Both types of plants are consumed by animals. Then, when the animals and plants die, or the animals excrete their food, the nitrogen returns back to the soil, where it is acted on by denitrifying bacteria. These cause the nitrogen to be returned to the air, and the cycle continues. |
Còn tiếp…..!
.png)
IELTS THƯ ĐẶNG CHÚC BẠN THI TỐT!
Thân mến,
THƯ ĐẶNG
 ĐĂNG KÝ KIỂM TRA ĐẦU VÀO - TƯ VẤN MIỄN PHÍ
ĐĂNG KÝ THI THỬ
.png) ĐĂNG KÝ KHOÁ LUYỆN ĐỀ VÀ GIẢI ĐỀ IELTS
ĐĂNG KÝ KHOÁ LUYỆN ĐỀ VÀ GIẢI ĐỀ IELTS
.png) ĐĂNG KÝ KHOÁ IELTS TIẾP THEO ( Dành cho học viên IELTS - Thư Đặng)
ĐĂNG KÝ KHOÁ IELTS TIẾP THEO ( Dành cho học viên IELTS - Thư Đặng)
.png)