


IELTS THƯ ĐẶNG- TRUNG TÂM LUYỆN THI IELTS UY TÍN, CHẤT LƯỢNG TẠI HÀ NỘI
Tham khảo các bài liên quan:
>>> Kinh nghiệm luyện thi IELTS
>>> Hướng dẫn làm bài thi IELTS
HƯỚNG DẪN CÁCH VIẾT LINE GRAPH IELTS WRITING TASK 1 NÂNG CAO.
Line Graph (Biểu đồ đường) là một trong những dạng bài thường hay ra thi nhất trong IELTS Writing Task 1. IELTS – Thư Đặng đã có chuỗi bài viết chia sẻ cách viết 7 dạng bài IELTS Task 1 . Tại bài viết này, IELTS – Thư Đặng sẽ hướng dẫn nâng cao cho các bạn cách viết Line Graph – IELTS Writing Task 1 đầy đủ và chi tiết nhất nhé!
1. Tổng quan về IELTS Writing Task 1 Line graph
Line Graph IELTS Writing Task 1 là gì?
Line Graph là biểu đồ đường gồm 1 hoặc nhiều đường biểu diễn cho sự thay đổi của một đối tượng nào đó qua các mốc thời gian. Khác với các loại biểu đồ khác, biểu đồ đường luôn có sự thay đổi theo thời gian. |
Biểu đồ đường có thể xuất hiện trong các tình huống khác nhau, như biểu đồ thể hiện sự biến động của sản lượng công nghiệp qua các năm, biểu đồ biểu diễn sự thay đổi của mức tiêu thụ năng lượng qua thời gian, hoặc biểu đồ so sánh giữa các yếu tố khác nhau như doanh số bán hàng của các sản phẩm trong một kỳ kinh doanh.
Biểu đồ đường thường gồm có 2 trục: trục ngang thường biểu thị thời gian hoặc các giá trị liên tục khác, trong khi trục đứng biểu thị giá trị của dữ liệu tương ứng với các thời điểm hoặc các giá trị trên trục ngang. Để đọc biểu đồ Line graph chỉ có 1 cách đọc duy nhất là đọc từ trái sang phải theo trục thời gian của từng đường tương ứng với mỗi đối tượng để thấy rõ xu hướng thay đổi của chúng.
Như yêu cầu của một bài báo cáo về biểu đồ ở writing task 1, thí sinh cần viết một bài báo cáo với ít nhất 150 từ và thời gian cần để viết bài thường dao động từ 15 đến 20 phút.
Có 2 dạng biểu đồ đường:
Dạng từ 1 đến 3 đường:
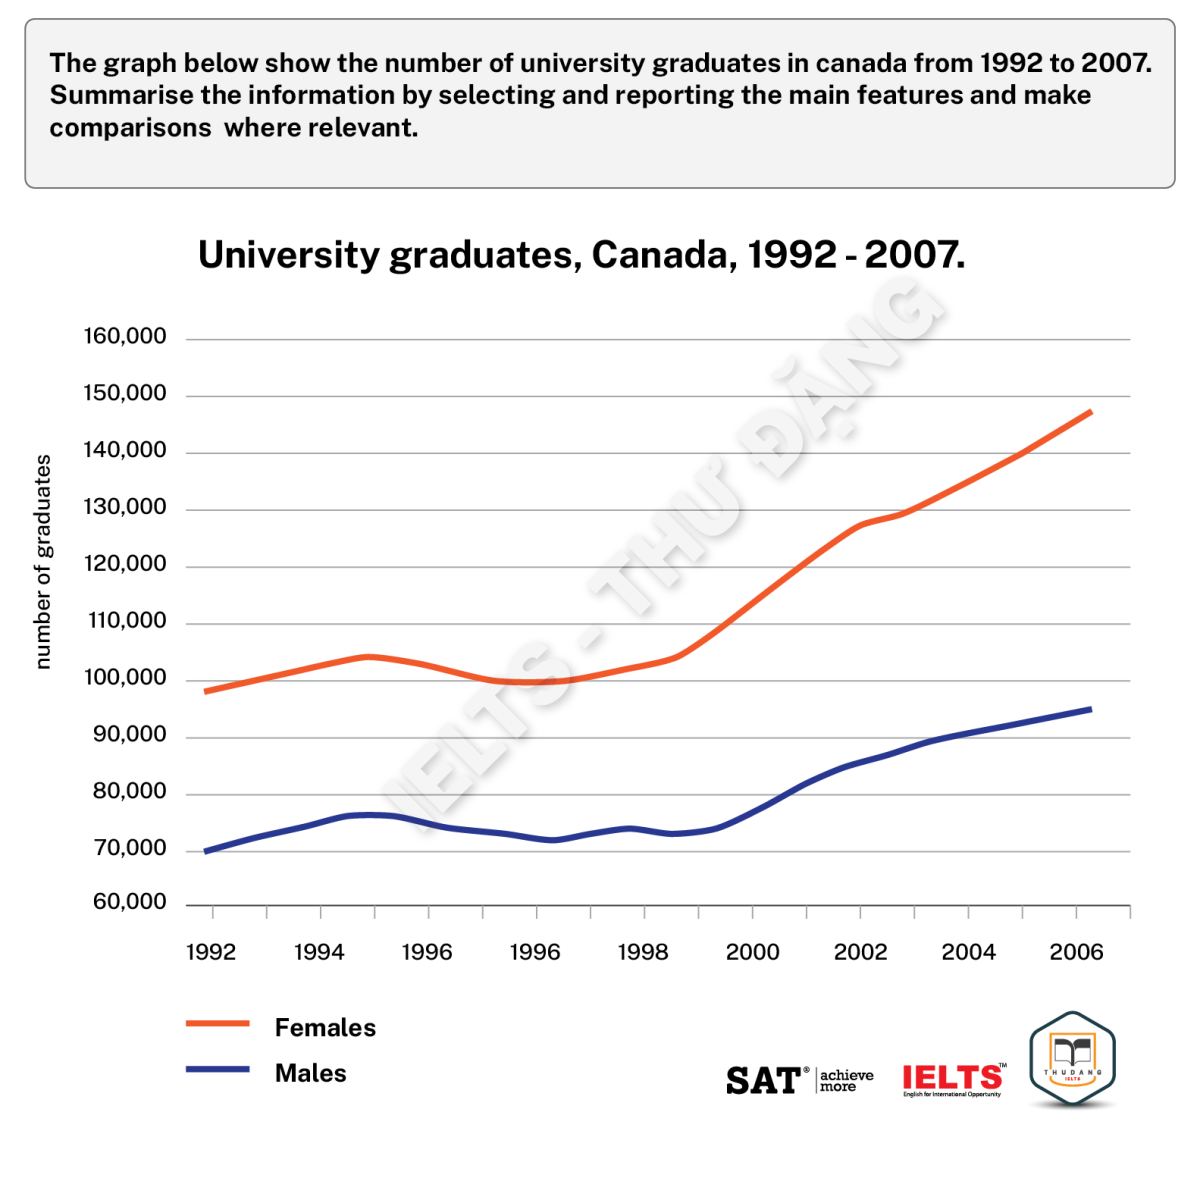
Loại bài này thường hiếm khi xuất hiện trong các đề thi. Trong trường hợp này, chúng ta cần tập trung vào việc so sánh hai đường với nhau, liên quan chặt chẽ đến yếu tố thời gian để làm rõ xu hướng tăng hoặc giảm, ổn định hoặc biến động của các đối tượng. Ví dụ:
Biểu đồ dưới đây cho thấy số sinh viên tốt nghiệp đại học ở Canada từ năm 1992 đến 2007. Hai đường màu hồng và xanh lần lượt biểu thị số sinh viên nữ và nam.
Dạng nhiều hơn 3 đường:
Trong các đề thi IELTS từ năm 2018 trở đi thì thường sử dụng dạng biểu đồ đường có nhiều hơn 3 đường. Ví dụ:
Biểu đồ dưới đây cho thấy kết quả của một cuộc khảo sát giữa những người lớn sử dụng mạng xã hội ở Mỹ từ 2012 đến 2015.
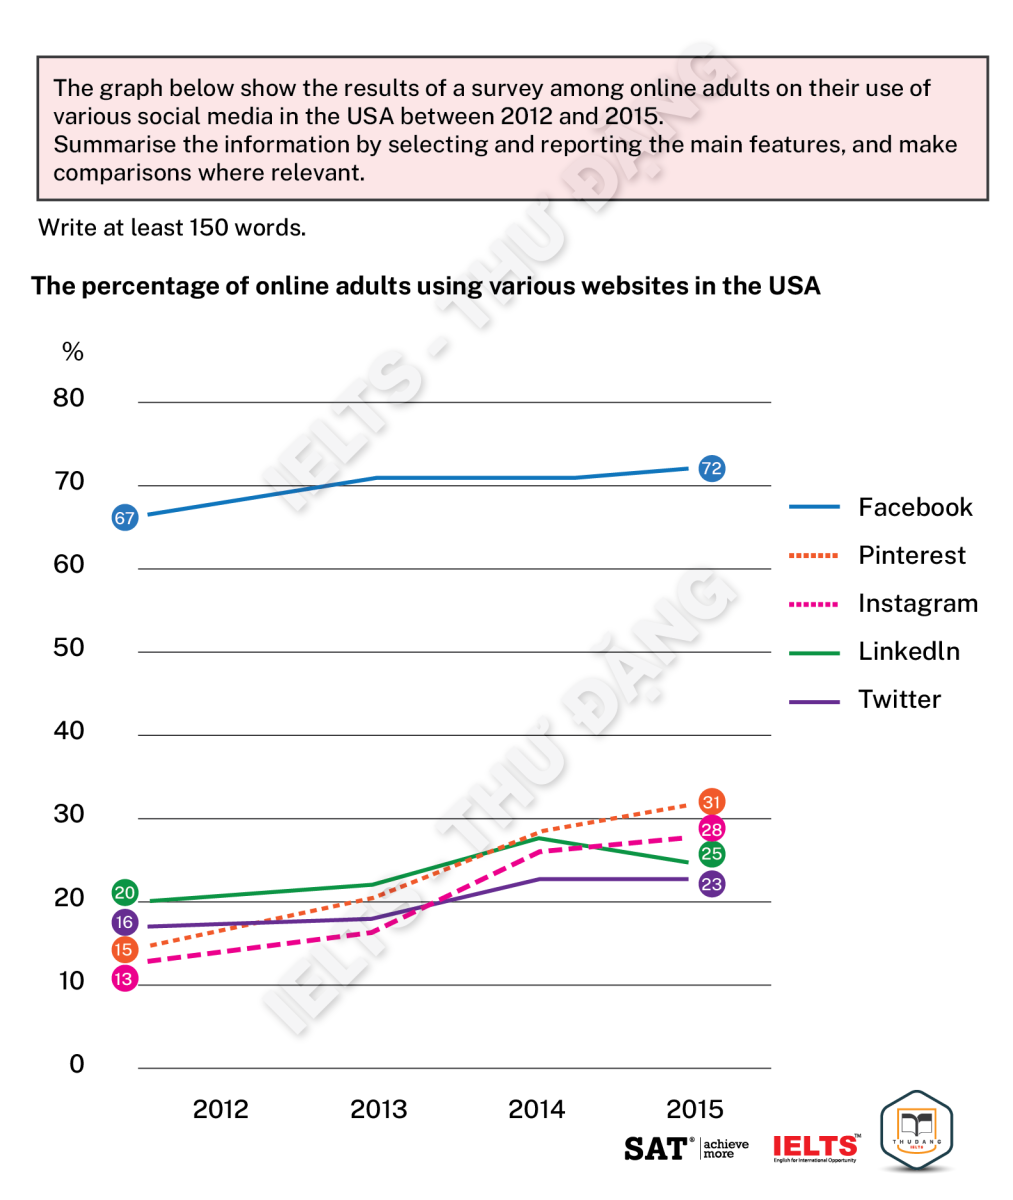
Nguồn hình: Ready for IELTS – Nhà xuất bản Macmillan
2. Cách viết IELTS Writing Task 1 Line graph
Trước khi viết mô tả biểu đồ đường trong writing Task 1, thí sinh cần lưu ý một số điểm chính sau: mô tả và so sánh dữ liệu, xác định xu hướng và biến động, điểm nổi bật (số liệu cao nhất/thấp nhất), sử dụng cấu trúc và từ vựng miêu tả/so sánh phù hợp.
Sau đây là các bước làm bài kèm bài mẫu:
Bước 1: Phân tích đề bài
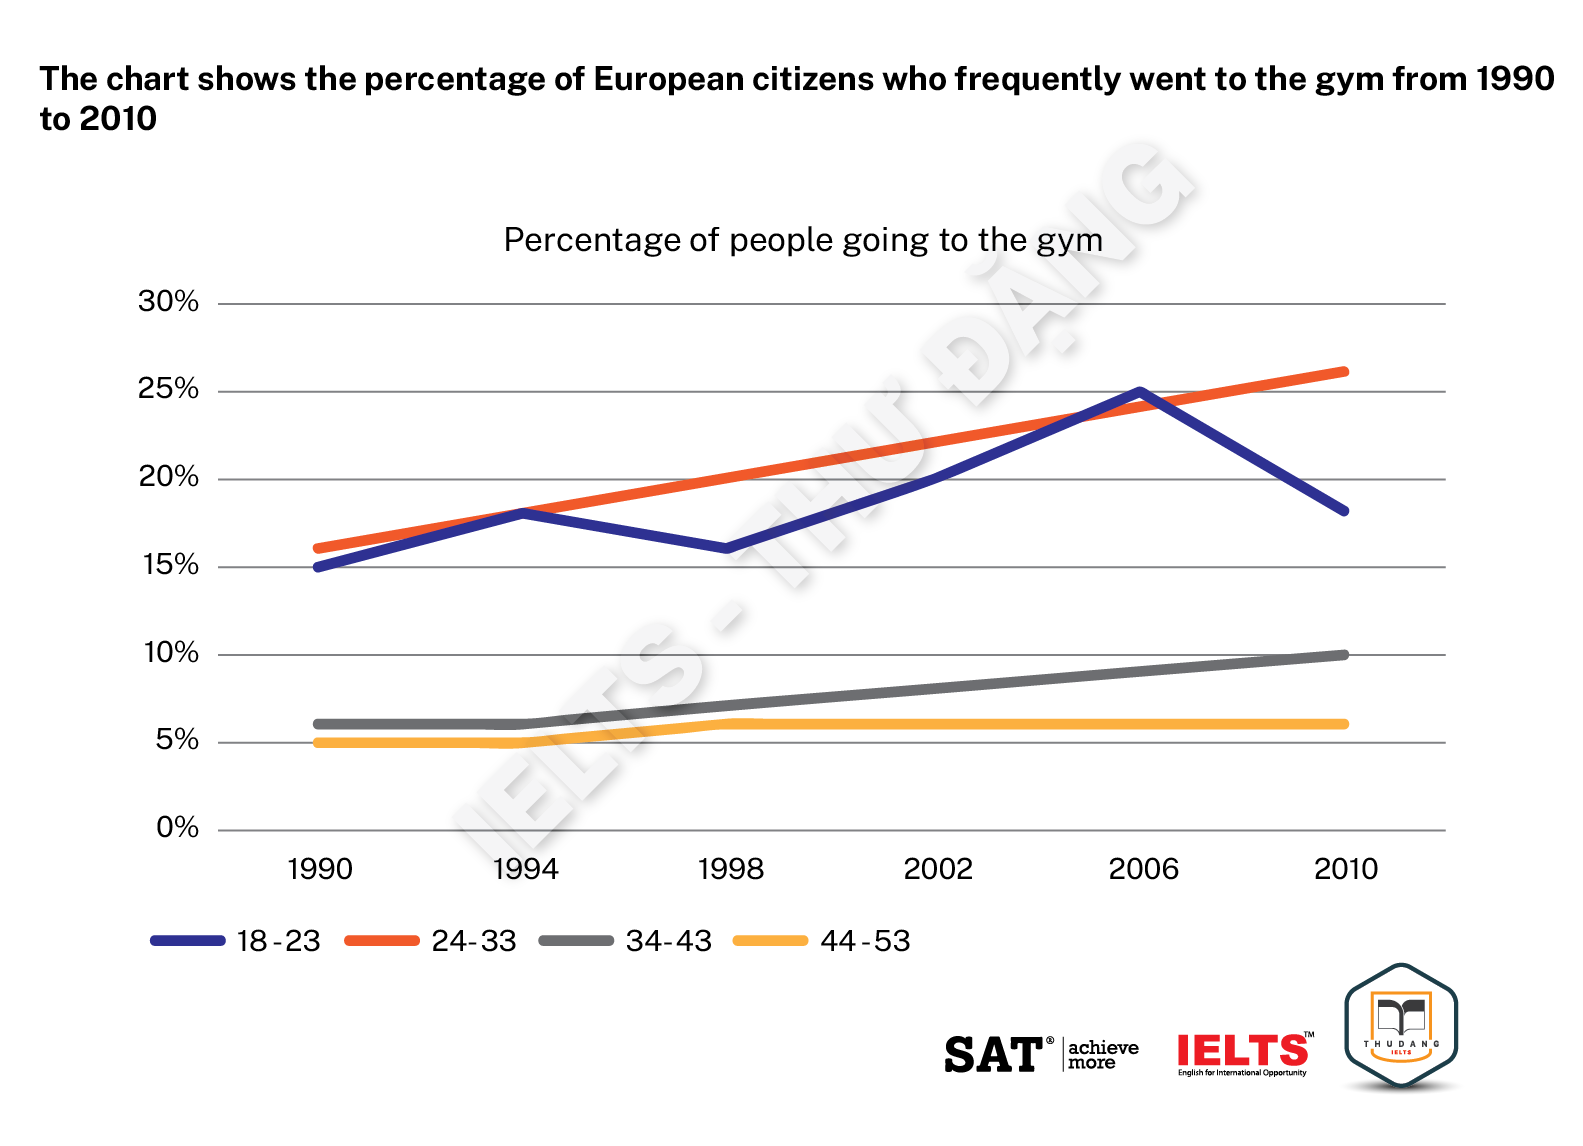
Số liệu trong biểu đồ diễn đạt thông tin gì: phần trăm cư dân châu Âu đến phòng tập gym
Số liệu được lấy ở đâu: châu Âu
Số liệu trong biểu đồ được lấy ở thời điểm nào: từ năm 1990 đến 2010
Bước 2: Viết mở bài (Introduction)
Sử dụng các thông tin trên cho việc paraphrase và viết mở bài.
=> The line graph illustrates the proportion of European people in various age groups who exercised frequently at the gym between 1990 and 2010
Bước 3: Viết tóm tắt (Overview)
Đối với biểu đồ có sự thay đổi theo thời gian, những thông tin nổi bật cần tìm kiếm bao gồm:
- Xu hướng tổng quan (sự thay đổi chung của số liệu qua các năm): hầu hết số liệu đều tăng qua các năm, ngoại trừ nhóm tuổi 18 đến 23 có xu hướng giảm.
- Số liệu cao nhất/ thấp nhất trong hình: số liệu của 2 nhóm lớn tuổi hơn thì thấp hơn nhiều.
Sử dụng những thông tin trên để viết đoạn tổng quan (overview):
=> In general, the percentage of those aged 18 to 23 fluctuated throughout the period, while the other figures increased gradually. Furthermore, the two older groups’ figures were much lower than the young.
Bước 4: Lựa chọn nhóm thông tin và viết Body 1 & 2
Đặc điểm của các biểu đồ trong Writing Task 1 là chỉ có từ 2 – 3 nhóm thông tin được đề cập. Xác định rõ các nhóm thông tin này sẽ giúp thí sinh bám sát vào nội dung bài, đồng thời đưa ra những lựa chọn phù hợp về danh từ và động từ cần sử dụng.Những thông tin chính trong biểu đồ trên gồm:The percentage of people – The figure/ number (số liệu) và people aged … (những người ở độ tuổi …).
Dựa theo những đặc điểm nổi bật đã được xác định ở đoạn tổng quan và sự tương đồng về xu hướng, thí sinh có thể gom nhóm số liệu như sau:
- Thân bài 1: miêu tả số liệu của nhóm tuổi 18-23 và 24-33
- Thân bài 2: miêu tả số liệu của nhóm tuổi 34-43 và 44-53
Hai đoạn thân bài:
Around 15% of people from 18 to 23 years old went to the gym in 1990, only 1% lower than the percentage of those aged 24 to 33. In the following years, the figure for citizens aged 24 to 33 increased steadily to approximately 26% in 2010. In contrast, the percentage of 18-to-23-year-olds fluctuated and peaked at 25% in 2006 before plunging to about 18% in 2010.
Regarding the two older age groups, only 5% of people in the 44-53 age group went to the gym in 1990, and this figure rose by only 1% throughout the whole period. The figure for those from 34 to 43 years old saw a more significant increase, as it went from about 6% in 1990 to 10% in 2010..
Bài viết hoàn chỉnh:
The line graph illustrates the proportion of European people in various age groups who exercised frequently at the gym between 1990 and 2010. In general, the percentage of those aged 18 to 23 fluctuated throughout the period, while the other figures increased gradually. Furthermore, the two older groups’ figures were much lower than the young. Around 15% of people from 18 to 23 years old went to the gym in 1990, only 1% lower than the percentage of those aged 24 to 33. In the following years, the figure for citizens aged 24 to 33 increased steadily to approximately 26% in 2010. In contrast, the percentage of 18-to-23-year-olds fluctuated and peaked at 25% in 2006 before plunging to about 18% in 2010. Regarding the two older age groups, only 5% of people in the 44-53 age group went to the gym in 1990, and this figure rose by only 1% throughout the whole period. The figure for those from 34 to 43 years old saw a more significant increase, as it went from about 6% in 1990 to 10% in 2010. |
Bài dịch:
Biểu đồ đường minh họa tỷ lệ người châu Âu ở các nhóm tuổi khác nhau tập thể dục thường xuyên tại phòng tập thể dục từ năm 1990 đến năm 2010.
Nhìn chung, tỷ lệ người trong độ tuổi từ 18 đến 23 dao động trong suốt thời kỳ, trong khi các số liệu khác tăng dần. Hơn nữa, số liệu của hai nhóm lớn tuổi thấp hơn nhiều so với nhóm trẻ.
Khoảng 15% người từ 18 đến 23 tuổi đến phòng tập thể dục vào năm 1990, chỉ thấp hơn 1% so với tỷ lệ của những người ở độ tuổi 24 đến 33. Trong những năm tiếp theo, tỷ lệ công dân từ 24 đến 33 tuổi tăng đều đặn lên khoảng 26 người. % vào năm 2010. Ngược lại, tỷ lệ người từ 18 đến 23 tuổi lại dao động và đạt đỉnh 25% vào năm 2006 trước khi giảm xuống còn khoảng 18% vào năm 2010.
Liên quan đến hai nhóm tuổi lớn hơn, chỉ có 5% số người trong độ tuổi 44-53 đến phòng tập thể dục vào năm 1990 và con số này chỉ tăng 1% trong cả thời kỳ. Con số này ở những người từ 34 đến 43 tuổi tăng đáng kể, từ khoảng 6% năm 1990 lên 10% năm 2010.
3. Từ vựng và cấu trúc câu sử dụng trong Line graph
3.1. Từ vựng
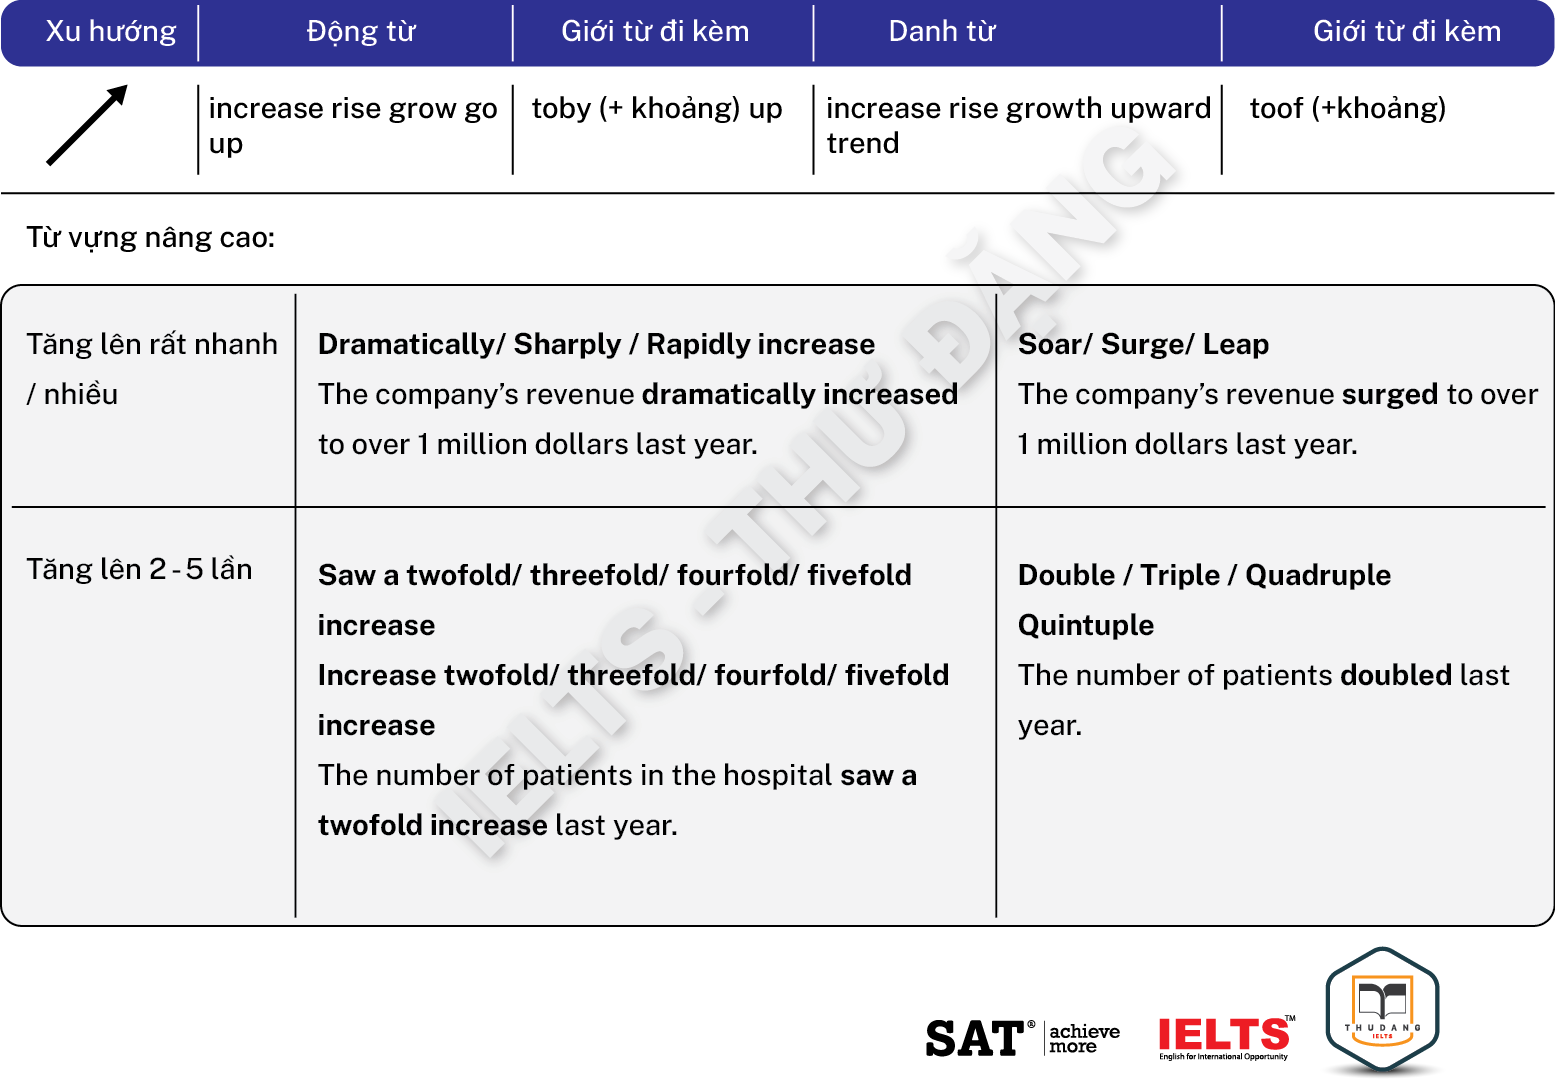
Mô tả xu hướng tăng
Từ vựng cơ bản:
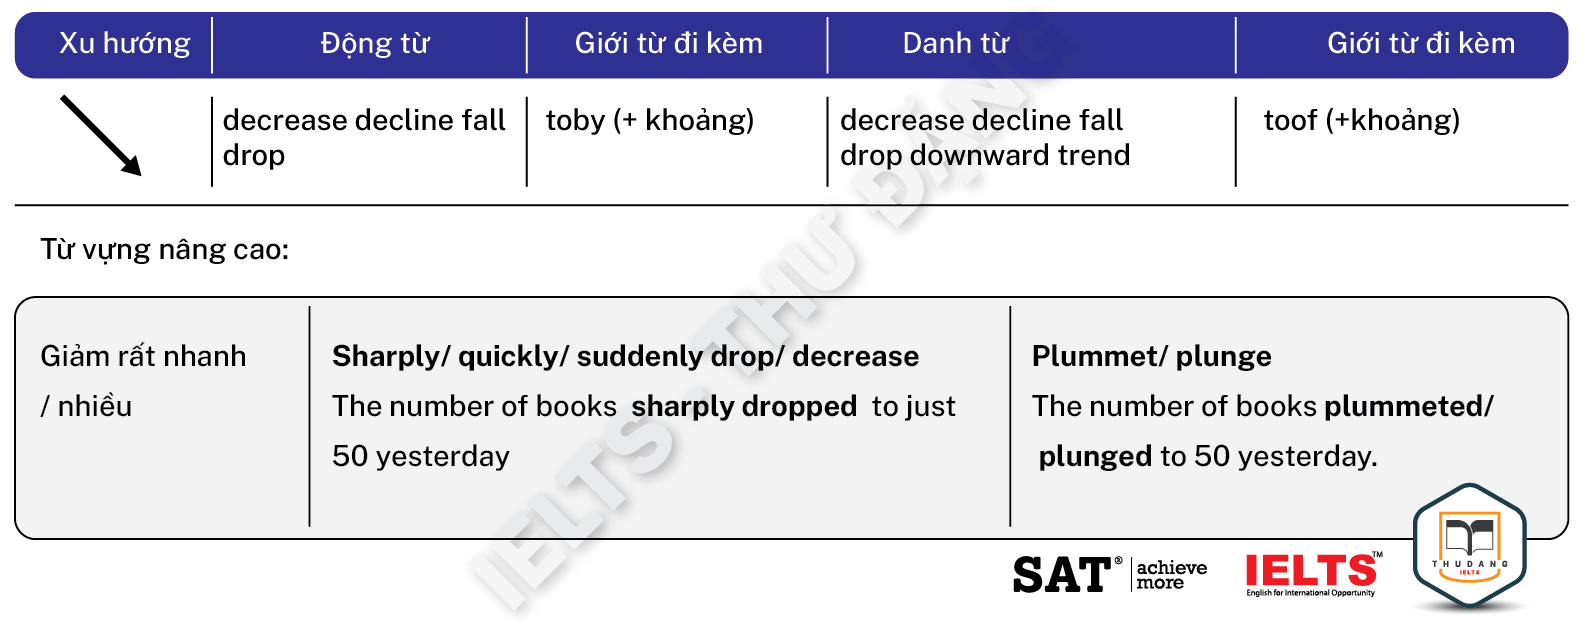
Mô tả xu hướng giảm
Từ vựng cơ bản:
Mô tả sự không thay đổi

Mô tả sự dao động

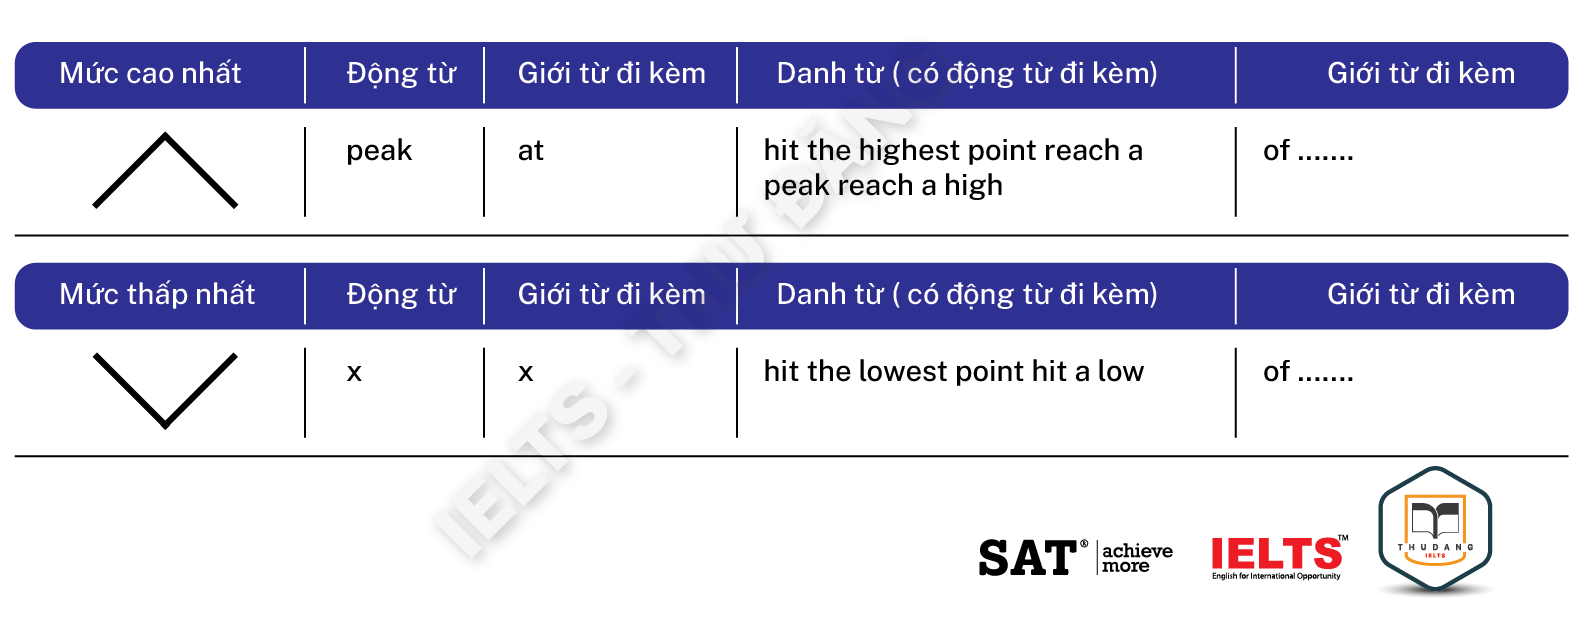
Mô tả mức thấp nhất/ cao nhất
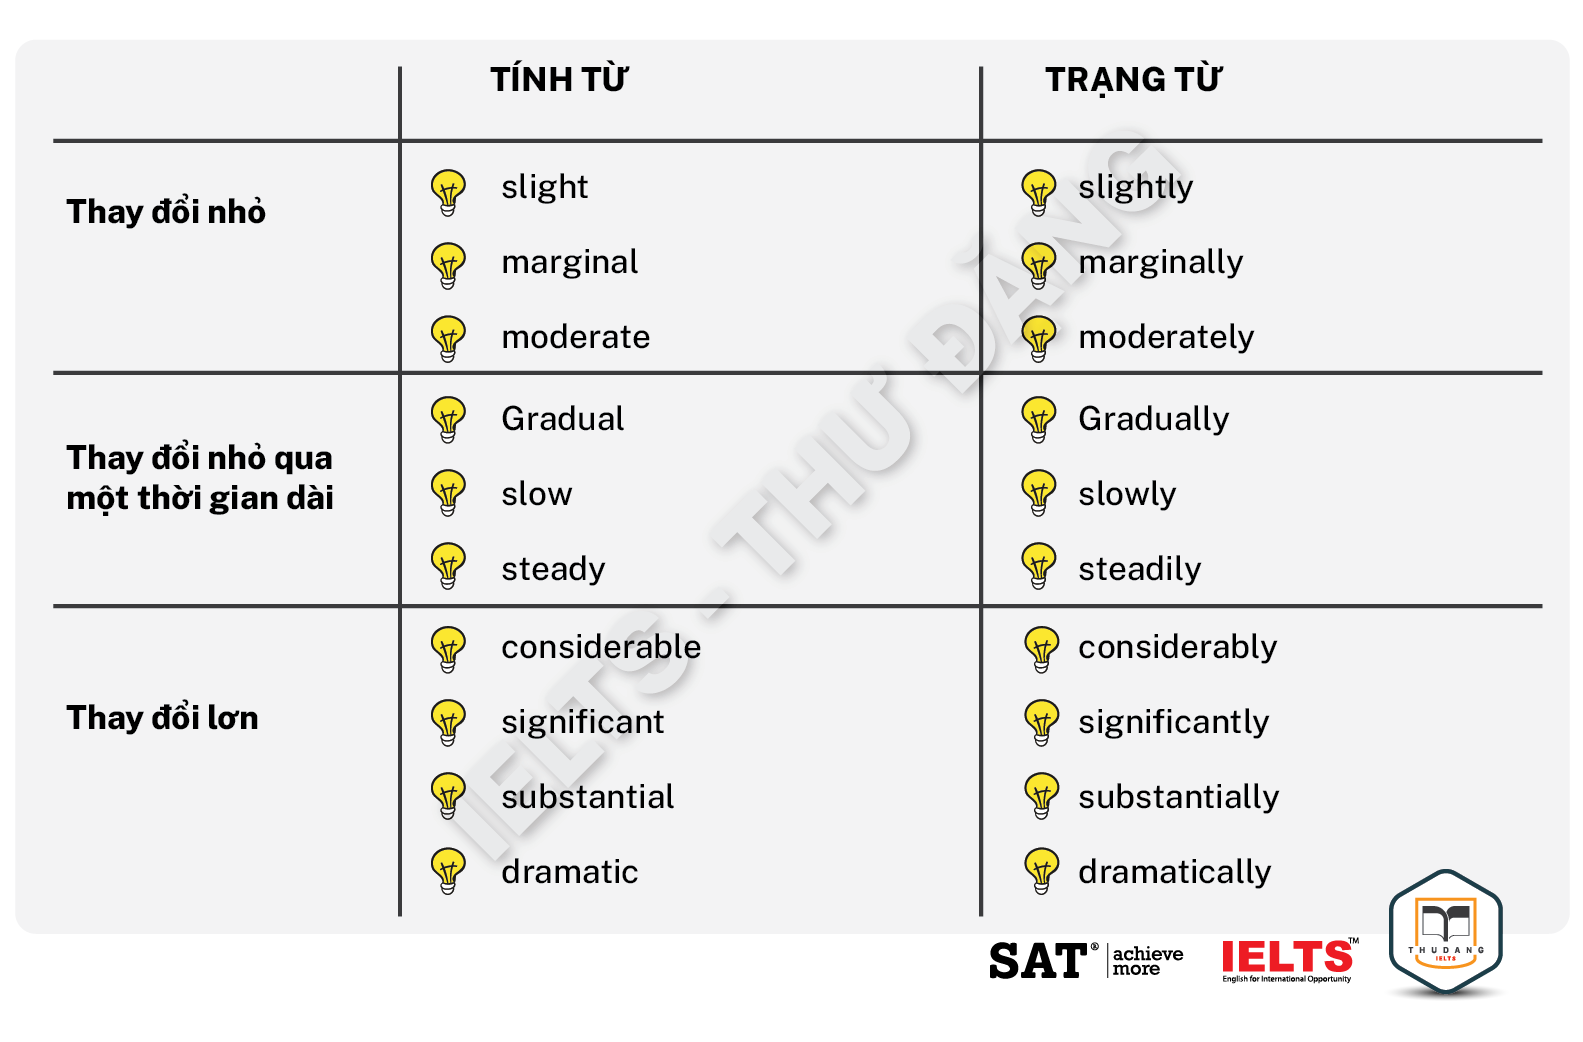
Mô tả tốc độ/ mức độ của sự thay đổi
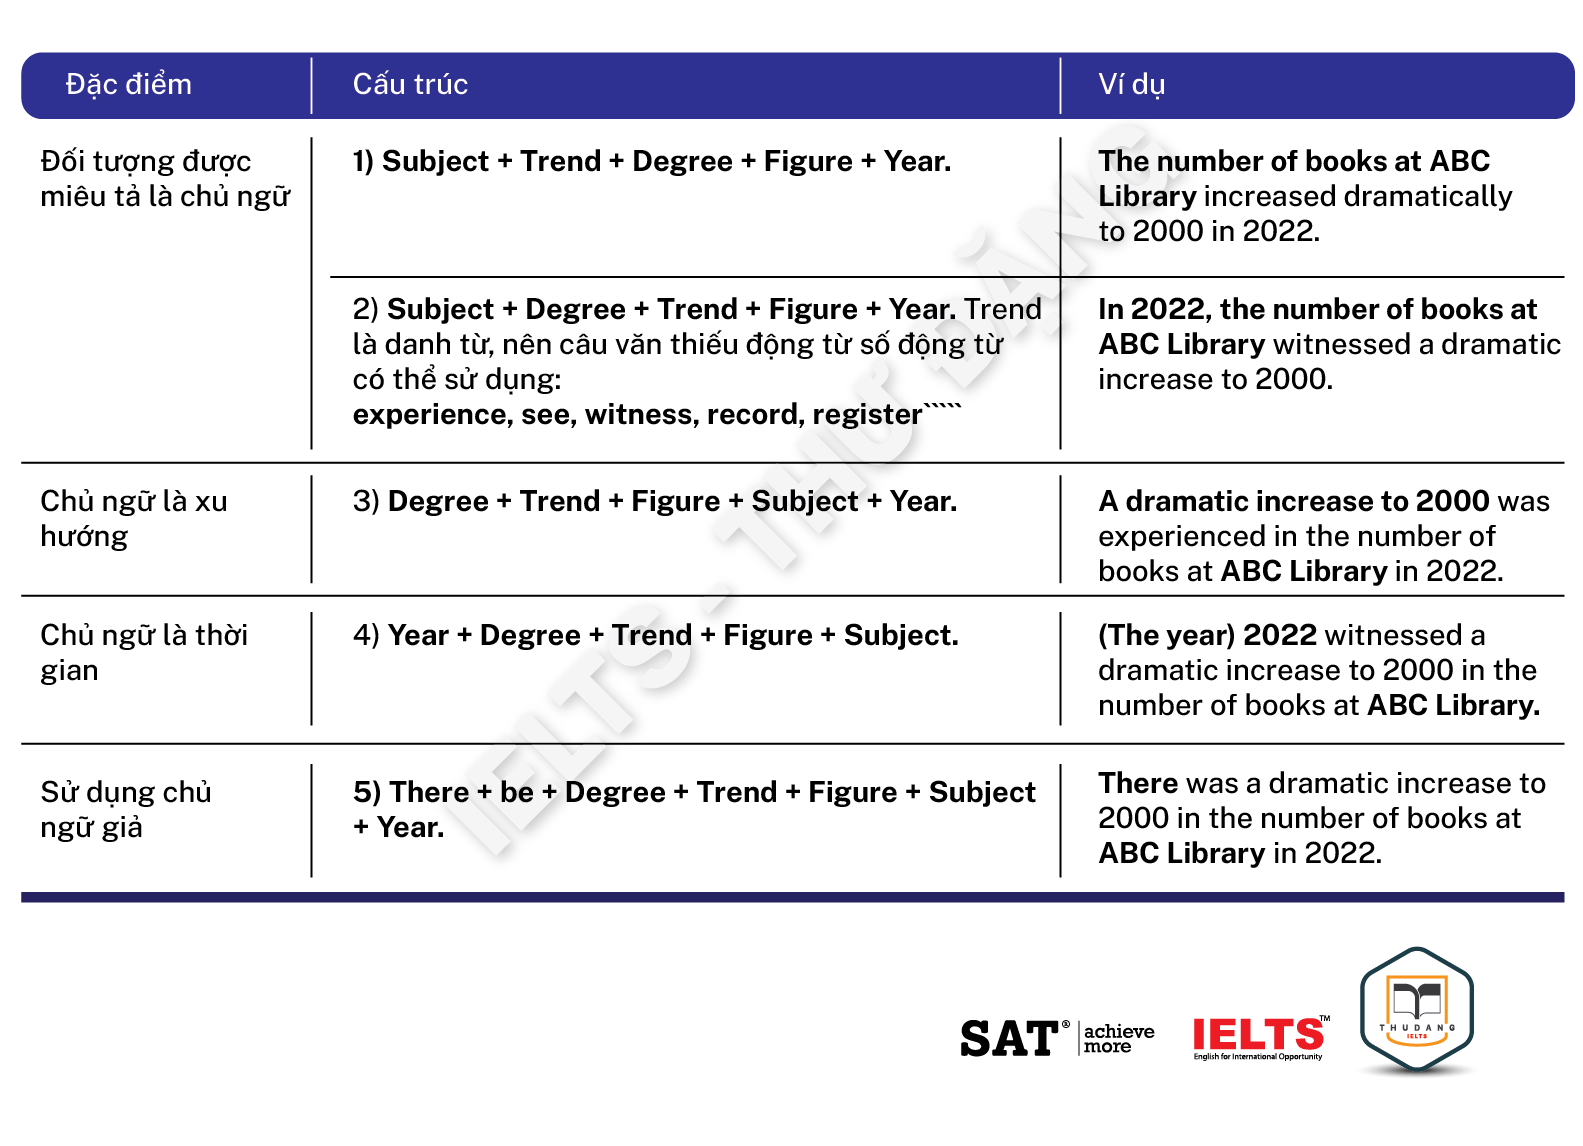
3.2. Cấu trúc câu
Câu đơn
Câu phức
- S + V before/ after + Ving (chỉ sử dụng khi 2 vế CHUNG CHỦ NGỮ)
Ví dụ: The number of books at ABC Library increased to 2000 in 2018 before falling to 1800 in 2020.
- S + V, followed by + Noun
Ví dụ: The number of books at ABC Library increased to 2000 in 2016, followed by a drop to 1800 in 2018.
- S + V while S + V (dùng để so sánh 2 nhóm số liệu đối lập)
Ví dụ: The number of books at ABC Library soared to 2000 in 2016, while the figure for school B dropped to 1500 in the same year.
4. Các lỗi thường mắc phải khi viết Line Graph
4.1. Sử dụng ý kiến cá nhân
Bài viết Task 1 thường yêu cầu thí sinh mô tả và so sánh các dữ liệu có sẵn, vì vậy việc nêu ý kiến cá nhân là không đúng với yêu cầu đề bài. Việc nêu ý kiến cá nhân có thể ảnh hưởng đến điểm số ở tiêu chí Task Achievement (bài viết có đáp ứng yêu cầu của đề bài không).
Ví dụ: In my opinion, people from 18 to 23 years old went to the gym more often than people aged 24 to 33 because they are healthier.
Việc đưa ra quan điểm rằng những người ở độ tuổi 18 đến 23 đi đến phòng gym thường xuyên hơn những người ở nhóm tuổi 24 đến 33 vì họ khoẻ mạnh hơn là không hoàn toàn chính xác. Những người ở nhóm tuổi 24 đến 33 có khả năng khoẻ mạnh hơn nếu họ duy trì một chế độ tập luyện khoa học và đều độ.
4.2. Thiếu sự so sánh (mô tả chi tiết từng đường)
Yêu cầu của bài viết Writing Task 1 là mô tả và so sánh dữ liệu, vì vậy việc thiếu các ý so sánh có thể ảnh hưởng đến điểm số ở tiêu chí Task Achievement (bài viết có đáp ứng yêu cầu của đề bài không).
Ví dụ:
Đối với thân bài chuẩn sau:
Around 15% of people from 18 to 23 years old went to the gym in 1990, only 1% lower than the percentage of those aged 24 to 33. In the following years, the figure for citizens aged 24 to 33 increased steadily to approximately 26% in 2010. In contrast, the percentage of 18-to-23-year-olds fluctuated and peaked at 25% in 2006 before plunging to about 18% in 2010.
Thí sinh viết thiếu ý so sánh sẽ có bài viết như sau:
Around 15% of people from 18 to 23 years old went to the gym in 1990. Only 1% lower than the percentage of those aged 24 to 33. In the following years, the figure for citizens aged 24 to 33 increased steadily to approximately 26% in 2010. The percentage of 18-to-23-year-olds fluctuated and peaked at 25% in 2006 before plunging to about 18% in 2010.
Có thể thấy ở đoạn trên, thí sinh không sử dụng các liên từ để kết nối thông tin để làm rõ ý so sánh và các câu văn có phần rời rạc không liên kết mà chỉ mang tính liệt kê.
4.3. Sử dụng sai giới từ
Lỗi về giới từ là một lỗi phổ biến làm ảnh hưởng đến điểm số của thí sinh trong tiêu chí Grammatical Range and Accuracy (phổ ngữ pháp và độ chính xác).
Ví dụ 1:
The figure of cars declined significantly to 230 in 1989.
Ở ví dụ trên, thí sinh sử dụng of thay cho for. Danh từ “the figure” cần được đi kèm với giới từ “for” và sau đó là một danh từ chỉ đối tượng đang được nói đến.
Câu chính xác: The figure for cars declined significantly to 230 in 1989.
Ví dụ 2:
There was a surge by 2000 in the figure for chocolate in the ABC factory in 2001.
Ở ví dụ trên, thí sinh sử dụng by thay cho of. Danh từ “surge” (một sự tăng mạnh) cần được đi kèm với giới từ of để chỉ một khoảng tăng bao nhiêu.
Câu chính xác: There was a surge of 2000 in the figure for chocolate in the ABC factory in 2001.
4.4. Sử dụng sai loại từ
Việc sử dụng sai loại từ (word form) gây ảnh hưởng đến điểm số của thí sinh trong tiêu chí
Lexical Resource (phổ từ vựng và độ chính xác trong việc sử dụng từ vựng).
Ví dụ 1:
There was a dramatically increase to 2000 in the number of books at ABC Library in 2022.
Câu chính xác: There was a dramatic increase to 2000 in the number of books at ABC Library in 2022.
Ở ví dụ trên, thí sinh nên sử dụng dramatic thay cho dramatically vì sau đó là một danh từ (increase).
Ví dụ 2:
A sharp grow was seen in the amount of electricity generated in 2016.
Ở ví dụ trên, thí sinh nên sử dụng growth thay cho grow vì growth là danh từ.
Câu chính xác: A sharp growth was seen in the amount of electricity generated in 2016.
4.5. Chia động từ
Chia động từ chưa chính xác là một lỗi cũng khá phổ biến khi thí sinh viết các dạng bài miêu tả biểu đồ đường. Việc này có thể ảnh hưởng đến điểm số của thí sinh trong tiêu chí Grammatical Range and Accuracy (phổ ngữ pháp và độ chính xác)
Ví dụ:
The numbers of boys and girls in X school drops to 200 and 300 respectively.
Ở ví dụ trên, lỗi chia động từ “drops” cho danh từ số nhiều “numbers” xuất hiện.
5. Bài mẫu IELTS Writing Task 1 Line graph
5.1. Bài mẫu line graph dạng 3 đường
Bài mẫu 1
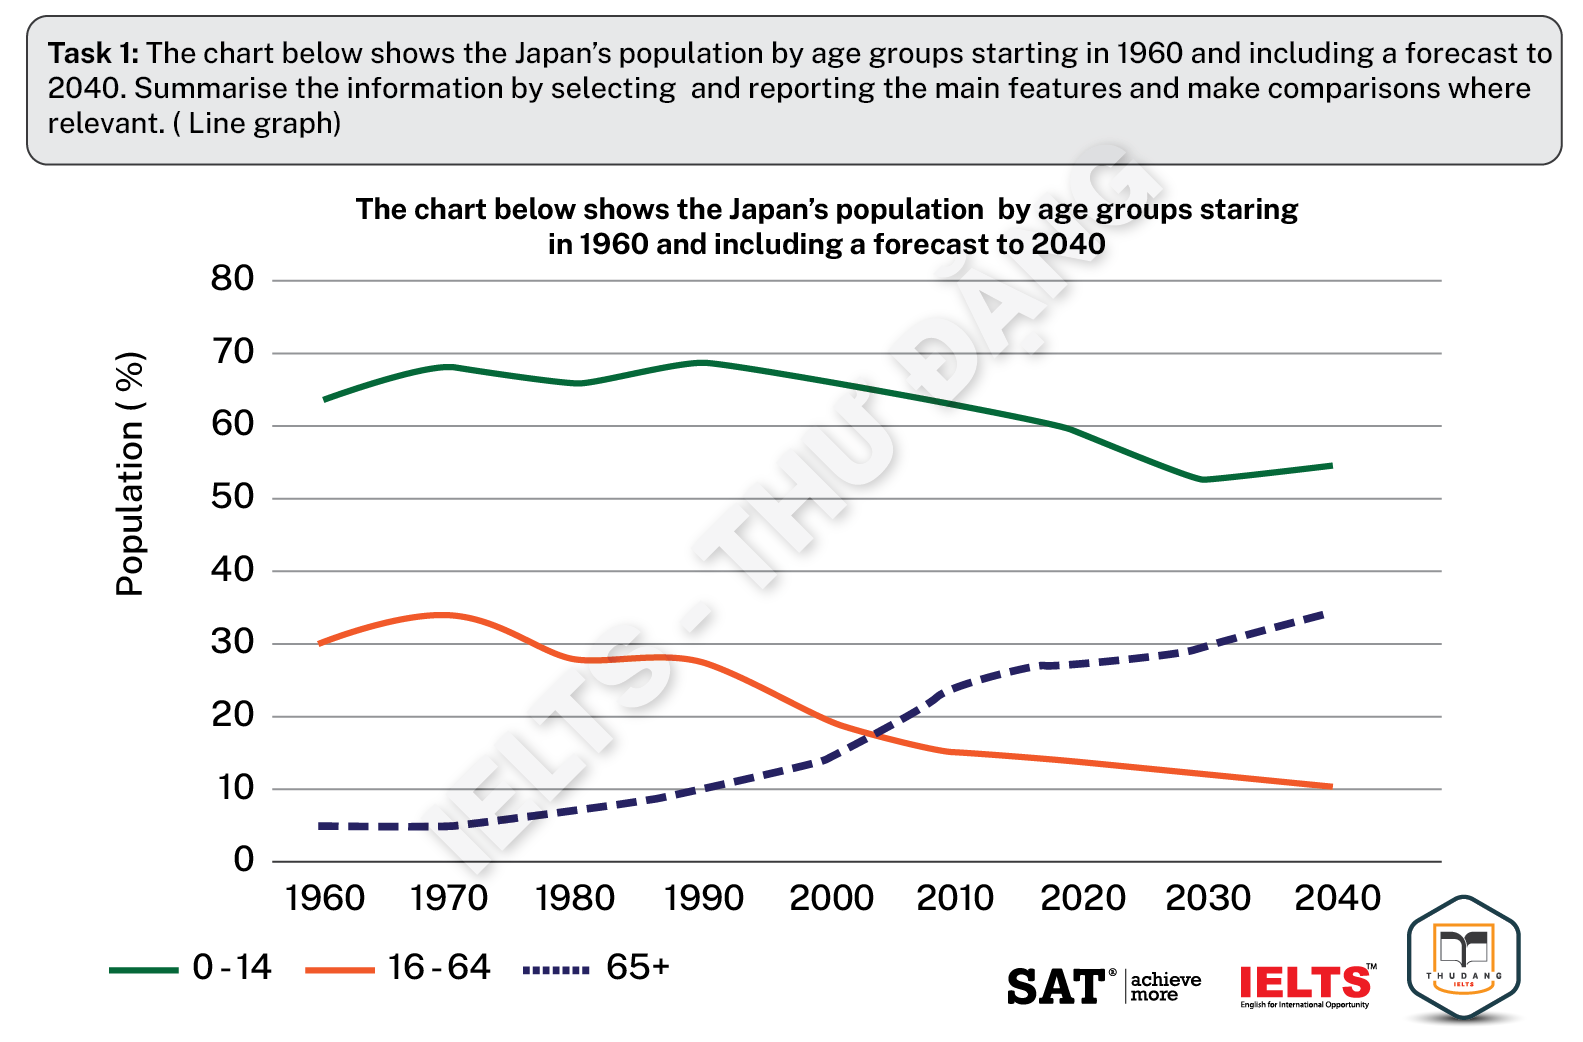
The given line graph gives details on the tendency of Japanese population over 3 age brackets from 1960 to 2020, and predicted figures between 2030 and 2040. Overall, it is clear that Japan experiences a young population and it is estimated that the youngest age group will remain dominant. In addition, downward trends are witnessed in the youngest and middle-aged groups while the opposite is true for the oldest population. Looking at the 0 to 14-year-olds category, despite being the most common age bracket, it sees a decline over the period shown. Starting at under two-thirds (62%) in 1960, its number slightly rose by 8% after 10 years and stayed nearly stable even with some fluctuations in 1990. The figure then gradually declined to three-fifths (60%) and by 2040, it is anticipated to have gone down to just over half (52%). A similar trend was seen in those aged 15 to 64 years old, with its proportion declining considerably from a third (30%) in 1960 to a fifth (20%) in 2000. By 2040, the middle-aged group is expected to have decreased to just 10%. A stark contrast was seen in the oldest age bracket, while its rise corresponds with the declines in the other two groups, it is still the lowest category. There was a significant increase of 5% in the initial year to 20% in 2000, reaching parity with the second group’s figure. The number is estimated to have nearly doubled by the final year.
|
Bài mẫu 2
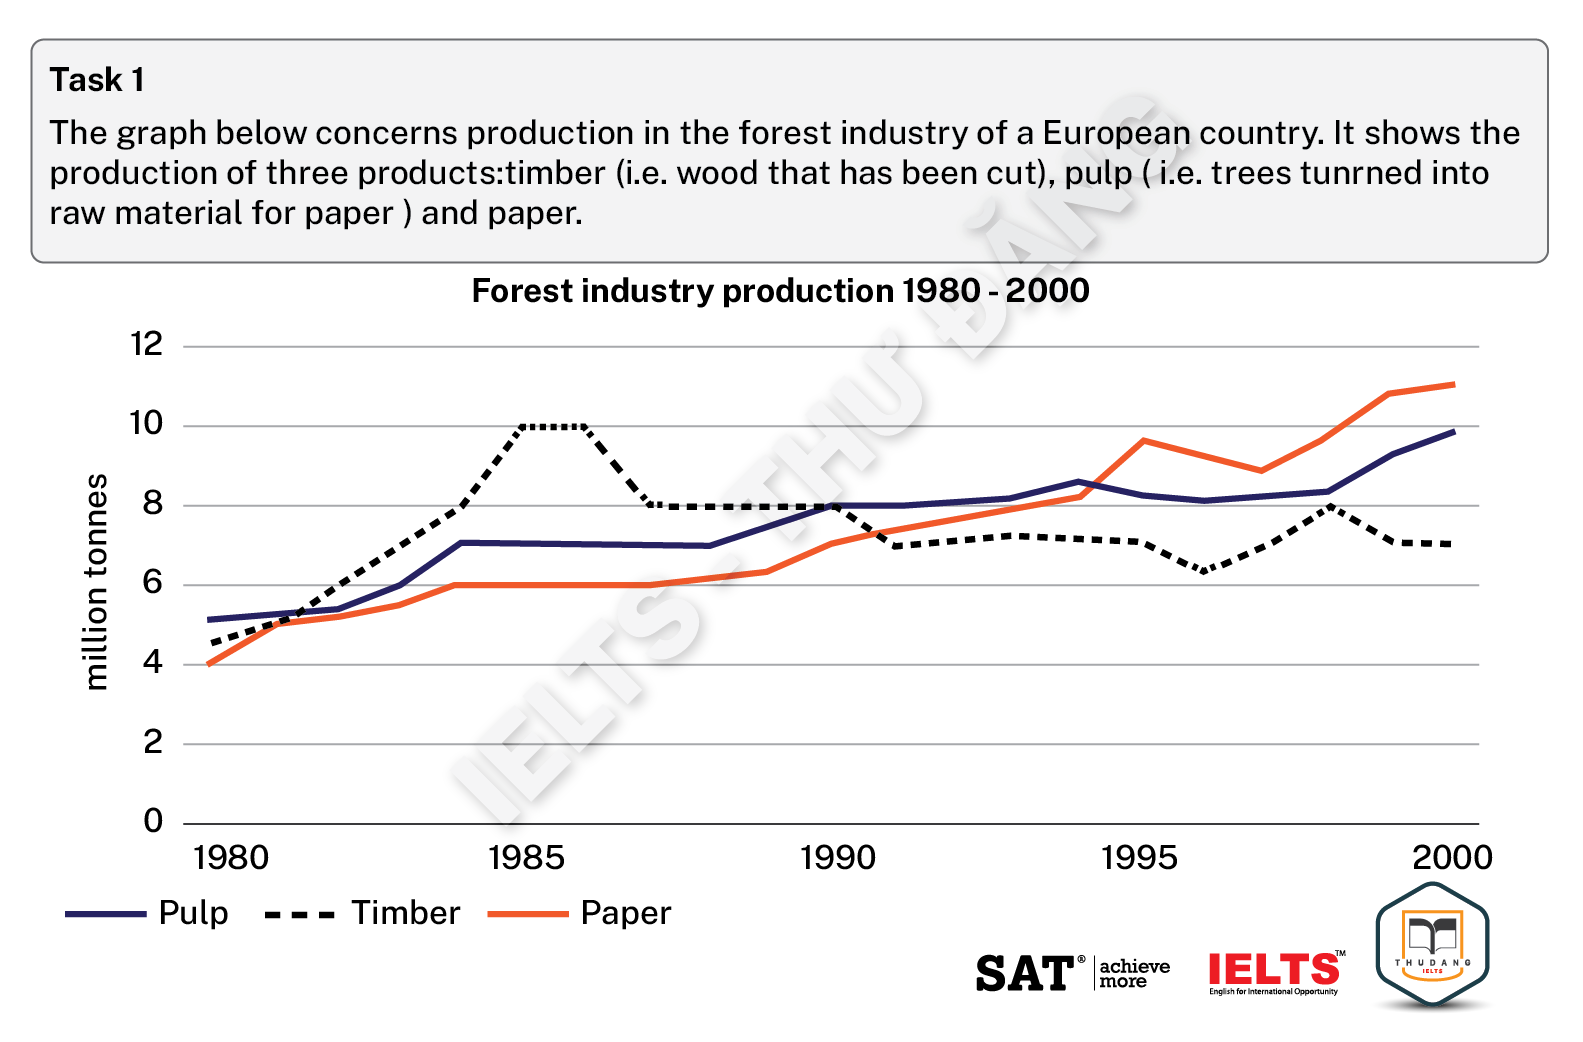
The line graph gives information about the figures for timber, pulp and paper produced in a European country, over a 20-year period from 1980 to 2000. Overall, it is clear that the production of pulp and paper saw upward trends during the period shown, with paper grew to become the first rank among the three products. In addition, timber production experienced some fluctuations over the entire period. Looking at pulp and paper figures, in 1980, the amount of pulp produced stood at around 5 million tones, which was slight higher than that of paper, at 4 million tones. An upward trend was recorded for the former group, with its number rising significantly to approximately 7 million tons in 1985, before staying unchanged in the next 4 years then increasing gradually to 10 million tons by the end of the period. A similar increasing trend was seen in paper production, as the number went up moderately to 6 million tons in 1985, then remained stable 4 years later before reaching a peak of around 11 million tons in 2000 in the final year. Regarding timber production, its figure started at under 5 million tons in the first year. There was a sharp increase in the production of timber over the next 5 years, with its number peaking at 10 million tons. However, a slight fall was seen in its number 2 years later, before remaining the same until 1990 and then fluctuating and decreasing to 7 million tons in the last year.
|
5.2. Bài mẫu line graph dạng nhiều hơn 3 đường
Bài mẫu 1
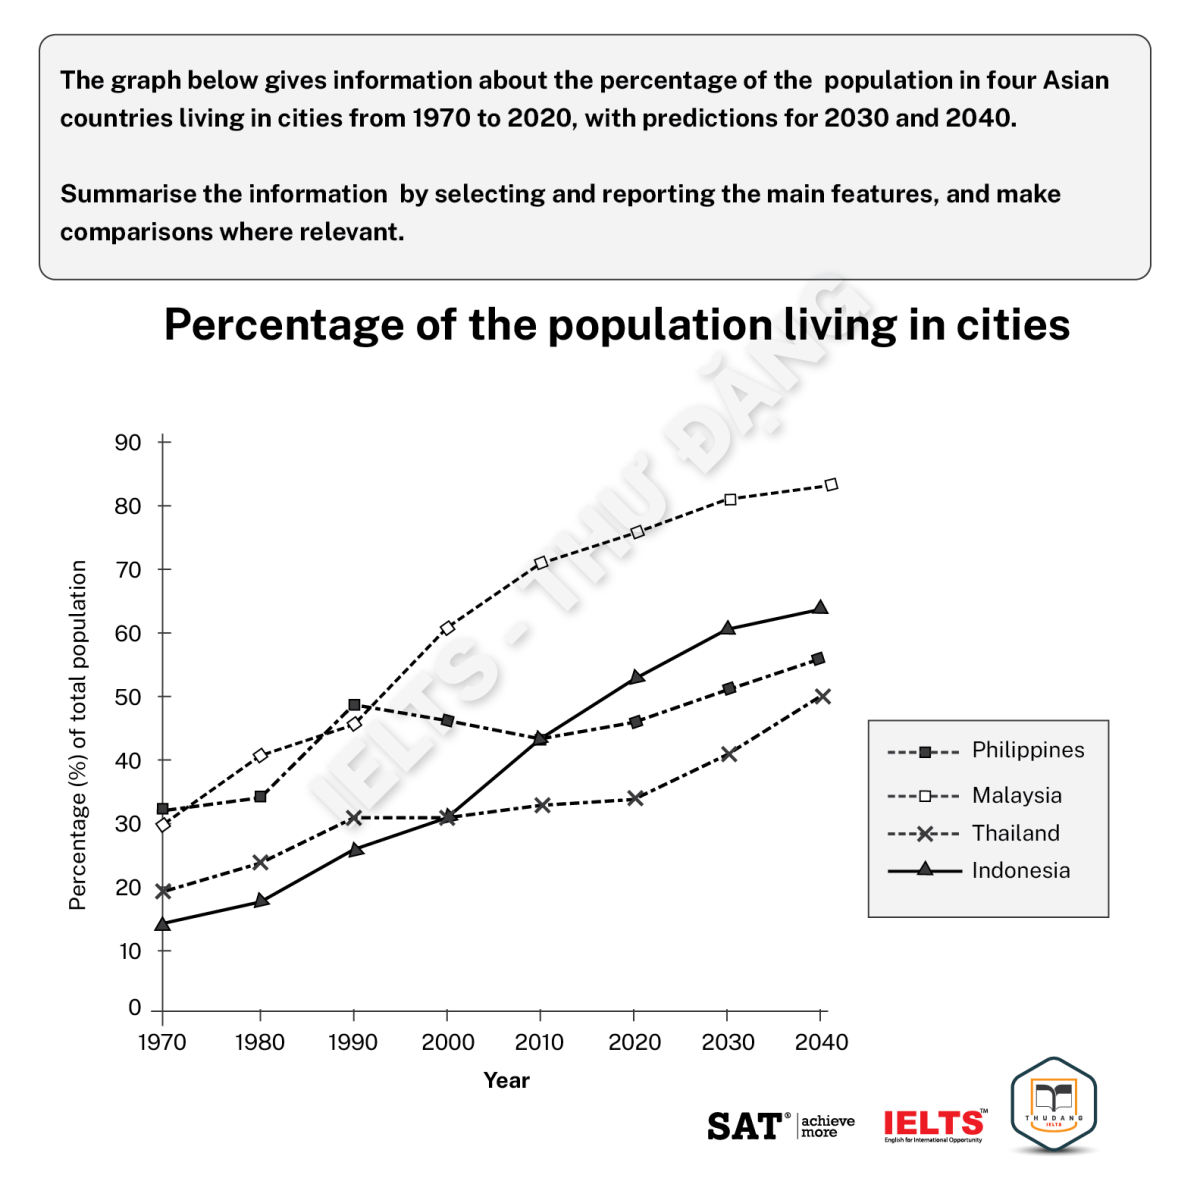
The given line graph illustrates the proportions of total population settling in urban areas in Philippines, Malaysia, Thailand and Indonesia, over a 50-year period between 1970 and 2020. Overall, it is clear that all of the 4 countries experienced upward trends during the period shown. In addition, the most dramatic change was witnessed in Indonesia and Malaysia had the highest population. Looking at Indonesia and Thailand, the figure for Thailand was slightly higher than that of Indonesia in 1970, at under a quarter each. Both numbers considerably increased before intersecting to a third in 2000. Despite rapidly increasing over two-thirds with the former and under a half with the latter in the final year, Indonesian citizens outnumbered Thailand’s and ranked second on the list. In terms of the other two countries, the percentage of both Malaysia and Philippines’ population was nearly similar, at a third. Regarding the former, its figure sharply went up to over two-fifths before soaring and hit a peak at around four-fifths at the end of the period. A similar trend was seen in the latter, in spite of some fluctuations in the first 40 years, its number recovered and gradually increased to more than half in 2020.
|
Bài mẫu 2
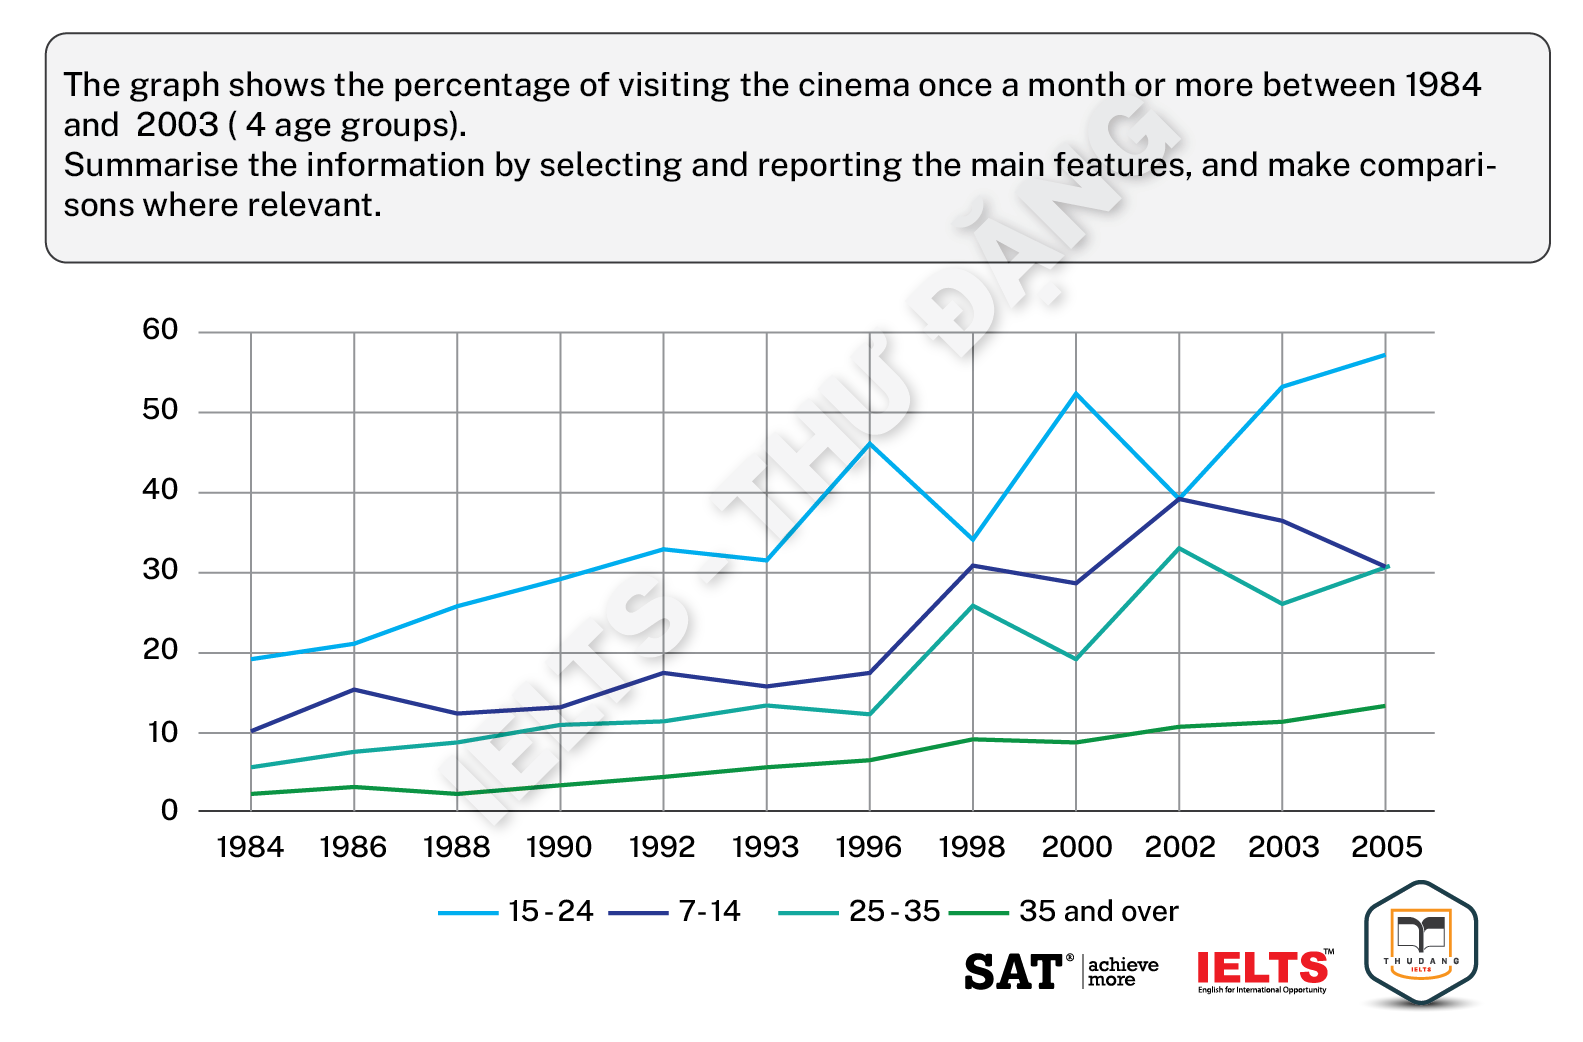
The line graph gives information about the proportion of people of different age groups going to the movies at least one time per month from 1984 to 2003. Overall, it is clear that the popularity of going to the cinema went up during the period shown among all four age brackets, with the 15-24 group doing so the most, while those above 35 years old had the least interest. Looking at younger individuals, in 1984, around one-fifth of those from 15 to 24 had the habit of visiting the cinema, far higher than the youngest group, 7-14, at about 12%. An upward trend was recorded for the former group, with its figures rising to around 30% in 1993, before fluctuating in the next 9 years then increasing again to appropriately 55% in 2005. A similar increasing tendency was seen in the 7-14 age bracket, as the numbers also rose to around 30% in 1993, but declined after that to only 25% in the final year. Regarding the other groups, there were around 5% of 25-to-35-year-olds and 2% of people older than that who went to the cinema at least once a month in 1984. The younger bracket’s numbers increased significantly, to nearly a quarter of respondents in 2005, despite some fluctuations from 1996 to 2003, while those for the older group did so far less significantly, rising to only about 17% in the last year.
|
Trên đây là chi tiết bài viết hướng dẫn cách viết Line Graph IELTS Writing task 1 nâng cao kèm theo bài mẫu. IELTS – Thư Đặng tin rằng sau khi đọc và thực hành bài viết sẽ cải thiện rõ rang về điểm số của mình.
Chúc các bạn học tốt!
Ngoài ra các bạn có thể tham khảo thêm rất nhiều nguồn tài liệu khác ở các thư mục của Website:
Xem thêm:
.png)
IELTS THƯ ĐẶNG CHÚC BẠN THI TỐT!
Thân mến!