


IELTS THƯ ĐẶNG- TRUNG TÂM LUYỆN THI IELTS UY TÍN, CHẤT LƯỢNG TẠI HÀ NỘI
Tham khảo các bài liên quan:
>>> Kinh nghiệm luyện thi IELTS
>>> Hướng dẫn làm bài thi IELTS
IELTS Writing Target 9 Band Essays is a Target 9 Band Essays samples to help you get familiarised with the format of IELTS Writing band 9 essays.
1. The line graph below shows the percentage of tourists to England who visited four different attractions in Brighton. Summarize the information by selecting and reporting the main features and make comparisons where relevant.
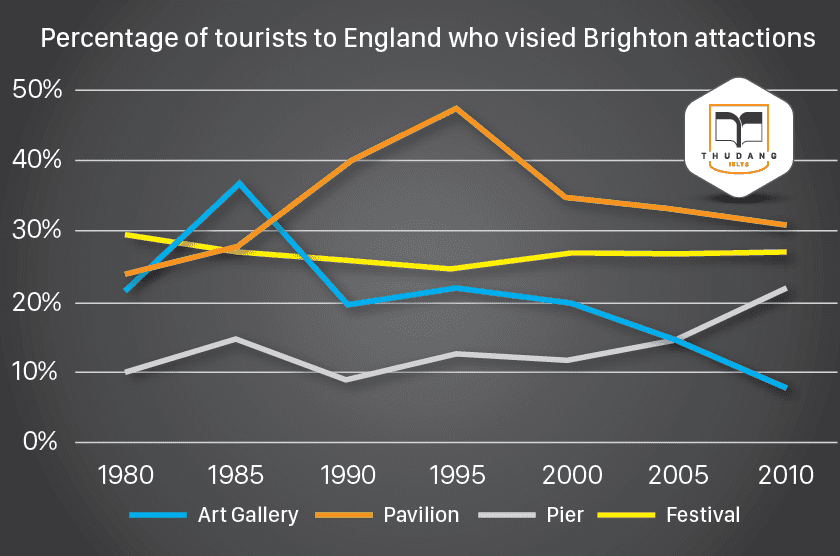
Sample answer: The polyline graph illustrates the proportion of visitors to England who went to four separate tourist attractions in Brighton between 1980 and 2010. Overall, it is clear that the percentage visiting the Pavilion and the Pier increased over the period. While the proportion of travellers to other attractions decreased. In 1980, only 10% of tourist to England went to Pier. Despite some minor fluctuations, this figure rose from around 9% in 1990 to 22% in 2010. The percentage visiting the Pavilion also increased, from approximately 23% in 1980 to almost 50% in 1995. However, this figure then decreased significantly, to about 35% in 2000 and then to roughly 31% in 2010, slightly higher than the Festival. The most popular Brighton attraction in 1980 for visitors to England was the Festival. Although 30% of these attended the Festival in 1980, by 2010 this percentage fell slightly to 28%. In 1980, the figure for tourists to the Art Gallery was 21%. It then grew to a peak of around 38%, before falling noticeably to exactly 20% in 1990. It continued to drop to less than 10% in 2010. It was, therefore, the least popular attraction at the end of the period.
|
2. The line graph shows the past and projected finances for a local authority in New Zealand. Summarize the information by selecting and reporting the main features and make comparisons where relevant.
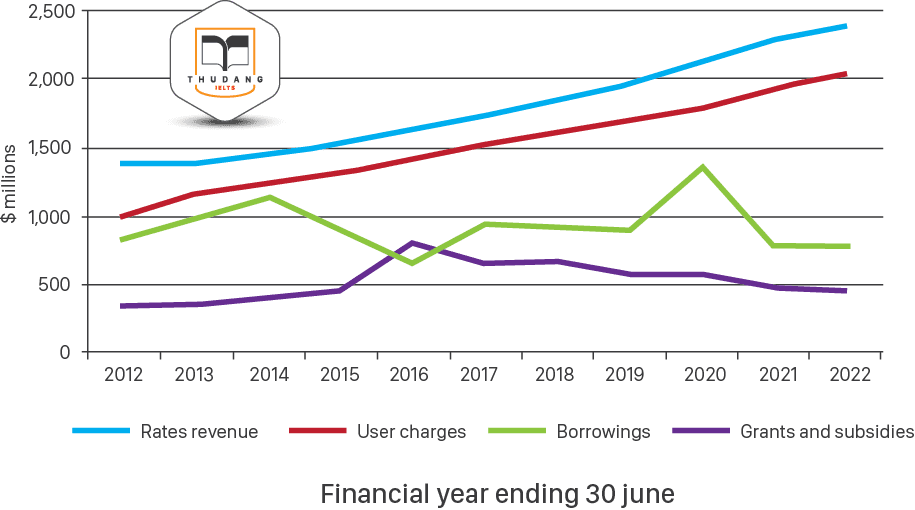
Sample answer: The polyline graph illustrates the financial position of a New Zealand local authority in millions from 2012 till the present and also shows the estimations till 2022. Overall, it is clear that rates revenue and user charges are predicted to increase over the period. While, borrowings and grants and subsidies are likely to remain much lower. Rates revenue and user charges increased moderately till 2018 and they are forecasted to follow the similar pattern over the rest of the time frame. Rates revenue stood at just under 1.5 billion in 2012, which was the highest of the four criteria. Though it remained stable for a year but then increased gradually until 2018, it is expected to climb to approximately 2.4 billion dollars in 2022. Like rates revenues, user charges are predicted to increase continuously. They began the period at 1 billion and are likely to become twice by 2022. Borrowings, on the other hand, showed considerable fluctuations and are expected to do same in the following years. Initially, they rose dramatically to about 1200 million in 2014 and followed a drop of 600 million in 2016.After that although they increased steadily but they are predicted to reach at peak of just under 1.5 billion in 2020 and likely to finish the period at around the same level from where they began. Grant and subsidies were the lowest of the four, at under 500 million in 2012. Despite moving up to exceed borrowing briefly in 2016, this lowest value is forecasted to decrease marginally over the rest of the time period.
|
3. The line graph shows the channel one news viewing figures per day in one year. Summarize the information by selecting and reporting the main features, and make comparisons where relevant.
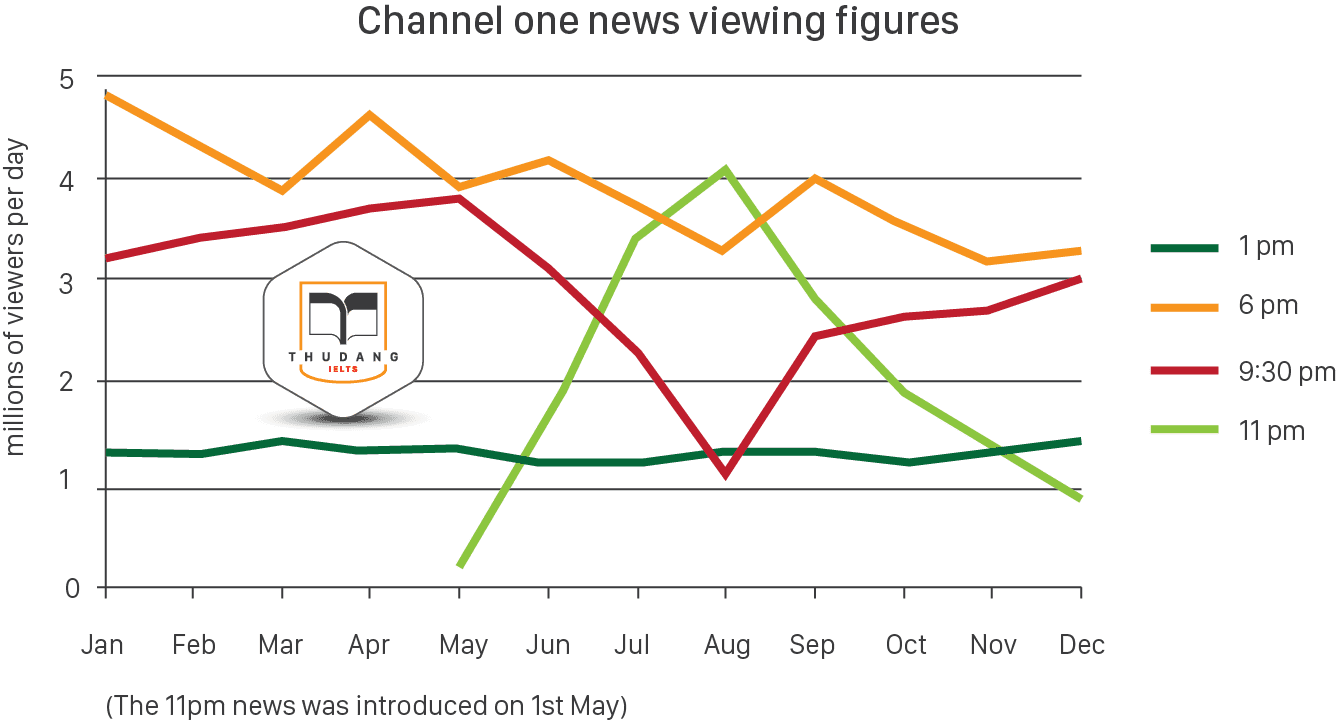
Sample answer: The line graph compares the number of viewers per day in millions between January and December of channel one news in the given year. Overall, it is clear that there was a significant difference in watching news at various time intervals. With the exception of 1 p.m. news, all the other news bulletins showed fluctuations in the news watchers. In January, approximately 5 million of viewers watched 6pm news, which was the highest figure compared with about 3 million of audiences chosen 9:30 pm news. However, the count of spectators remained stable at 1.3 million on 1pm news from January to December. While the 11pm news bulletin was introduced on 1st May which gained instant popularity starting with under 0.5 million people watching it. Further analyzing the graph, the number of viewers of 11 pm news increased sharply to reach the peak at 4 million in august followed by sudden drop to 0.9 million at the end of the year. Whereas the figure for 9:30 pm news followed a steadily increasing trend in the starting months of the year which then decreased significantly from May to August and noted at 1 million which was the least value, however a recovery was noticed till end of the term. The 6pm news witnessed a fluctuating trend in terms of news watchers during whole time period at just over 3 million viewers in December.
|
4. The chart below shows the percentage of female members of parliament in 5 European countries from 2000 to 2012. Summarize the information by selecting and reporting the main features, and make comparisons where relevant.
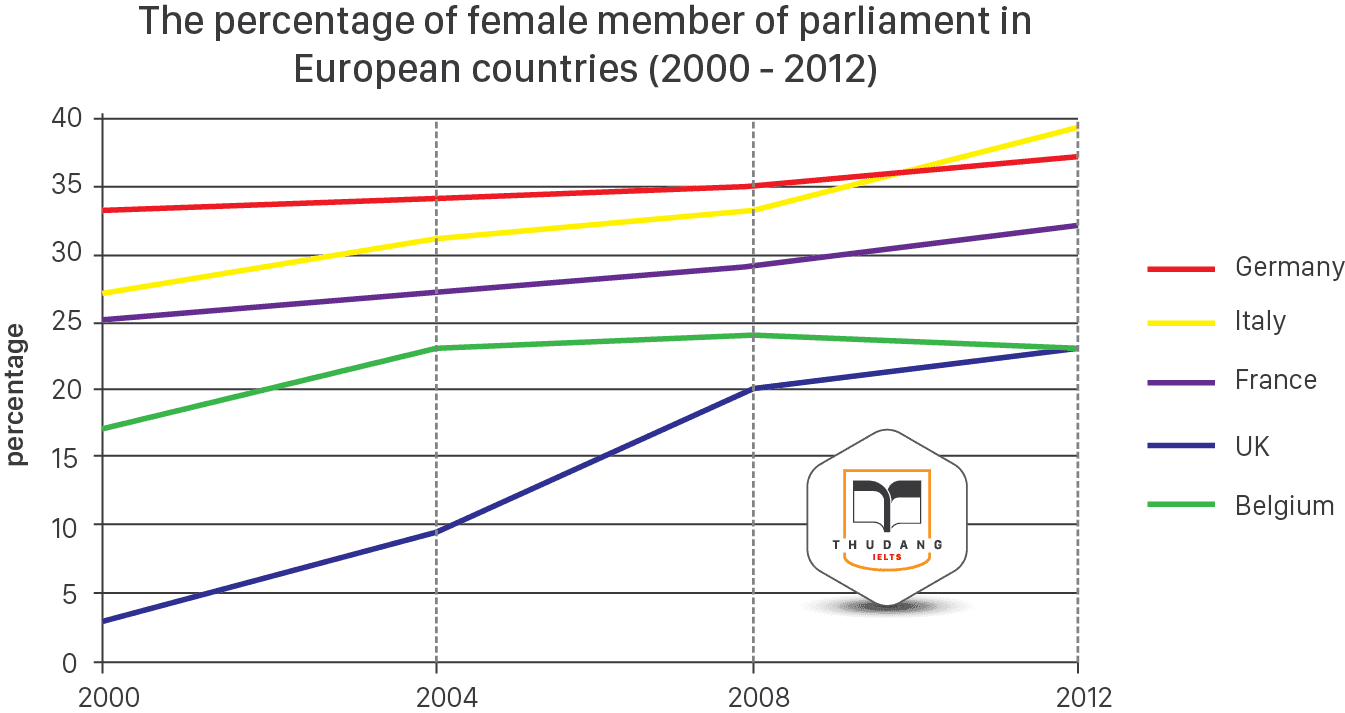
Sample answer: The line chart compares the proportion of female parliament members of five different countries in Europe between 2000 and 2012. Overall, it is clear that the figures for the female members in European nations increased throughout the given period. While the percentage of female MPs in Germany was by far highest overall, the figure for UK was lowest in each year shown. In 2000, Germany had the highest percentage of female MPs, at around 33%, followed by Italy, France and Belgium having approximately 27%, 25% and 17% respectively. The proportion of female MPs during the initial year in the UK was nearly one tenth that for Germany, at merely around 3%. Between 2000 and 2010, the figure for Germany increased slowly, while that of Italy saw a moderate incline. In 2010, Italy overtook Germany as the country having the highest percentage of female MPs and reached at around 38% in 2012 Over the given 12 year period, the percentage of female MPs in France and Belgium rose by about 6%. While the figures for France inclined marginally over the given time frame, Belgium witnessed slight up and down in the number of Female MPs. The proportion of female parliament members in the UK saw a significant increase from 3% to 20% between 2000 and 2008 but after that the figure rose slightly by just 3% in the next four years. |
5. The bar chart below shows shares of expenditures for five major categories in the United States, Canada, the United Kingdom, and Japan in the year 2009.Summarize the information by selecting and reporting the main features and make comparisons where relevant.

Sample answer: The bar chart compares how consumers in the United States, Canada, the United Kingdom, and Japan allocated different shares of total spending to categories such as food, housing, and transportation in 2009. Overall, it is clear that maximum proportion of budget was allocated on housing by all the given four nations . While least money was spent on health care by these countries except USA in which clothing area got least preference. To begin with, the United States had the highest housing expenditure share, 26% of total expenditures in 2009. The United Kingdom and Japan followed, with 24% and 22%, respectively. Canada had the lowest housing share at 21%. Housing was the largest expenditure component in all countries except Japan . By contrast, Canada had the largest transportation share of all four countries at 20%. The United States and the United Kingdom had the next-highest transportation shares, 17% and 15%, respectively. Japan had the lowest, at 10%. Further analyzing the graph, in Japan, consumers spent 23% of their total expenditures on food in 2009. The United Kingdom had the second-highest share at 20%. Canada, with 15%, and the United States, with 14% had the lowest food expenditure shares among the countries studied . The least figures were seen in case of health care where Canada and Japan spent equal proportion of their money (4%) each and mere 1% was allocated by United Kingdom which was minimum among all given countries. |
6. The bar chart below gives information about the percentage of the population living in urban areas in the world and in different continents. Summarize the information by selecting and reporting the main features, and make comparisons where relevant.

Sample answer: The column graph gives data on the growth of urban population in different continents of the world for 1950, 2007 and also the projection for the year 2030. Overall, the percentage of people who lived in urban areas increased from 1950 to 2007. Also, it is forecasted that more people are likely to live in cities in the future. To begin with, the percentage of the population in urban areas increased significantly in 2007 as compared to 1950. In 1950, on an average 29% people of the world lived in the urbanized regions. In this year, the highest percentage of the population was 64%, witnessed in North America. In Africa and Asia, these percentages were lowest, recorded to be 15% and 17% respectively. Just above half of the total Europeans settled in urban areas in the year 1950, while this percentage was 42% in Latin America. After 57 years in 2007, the percentage of urban population reached to 49% in the world. North America again had the highest share of inhabitants who lived in urban regions. In this year the lowest percentage was noticed in Africa (37%) while in other continents, the percentages of the city dwellers was around 40 to 75. Further analyzing the graph, it is projected that six out of ten persons in the world are likely to live in urban areas in 2030. This percentage is anticipated to be more than 80 in both of the American continents while almost the same ratio which was noted in 2007 is expected to prevail as far as Europe is concerned. Turning to Asia and Africa, it is forecasted that little more than half of their population would live in urban areas in 2030.
|
7.The chart shows British Emigration to selected destinations between 2004 and 2007. Summarize the information by selecting and reporting the main features and make comparisons where relevant.

Sample answer: The bar chart demonstrates the selected destination countries which people of UK chosen to emigrate from 2004 to 2007. Overall, it can be clearly seen that throughout the period, the most popular place to move to was Australia. While, New Zealand and USA were least preferred by Britons to migrate among the five given destination countries. To begin with, it is evident that emigration to Australia stood at just over 40,000 people in 2004, which was approximately 6,000 higher than for Spain, and twice as high as the other three countries. Apart from a jump to around 52,000 in 2006, it dropped slightly in the last year. The next most popular country for Britons to move to was Spain, though its popularity declined over the time frame to finish at below 30,000 in 2007. Despite this, the figure was still higher than for the remaining three countries. Approximately 20,000 people migrated to New Zealand from UK each year, while for USA the number fluctuated between 20,000 to 25,000 over the period. Although the number of emigrants to France spiked to nearly 35,000 in 2005, it was the country that was the least popular to move to at the end of the period with just under 20,000 people who chose to go there. |
8.The bar charts below show the Marriage and Divorce Statistics for nine countries in 1981 and 1994. Write a short report for a university lecturer describing the information shown below.
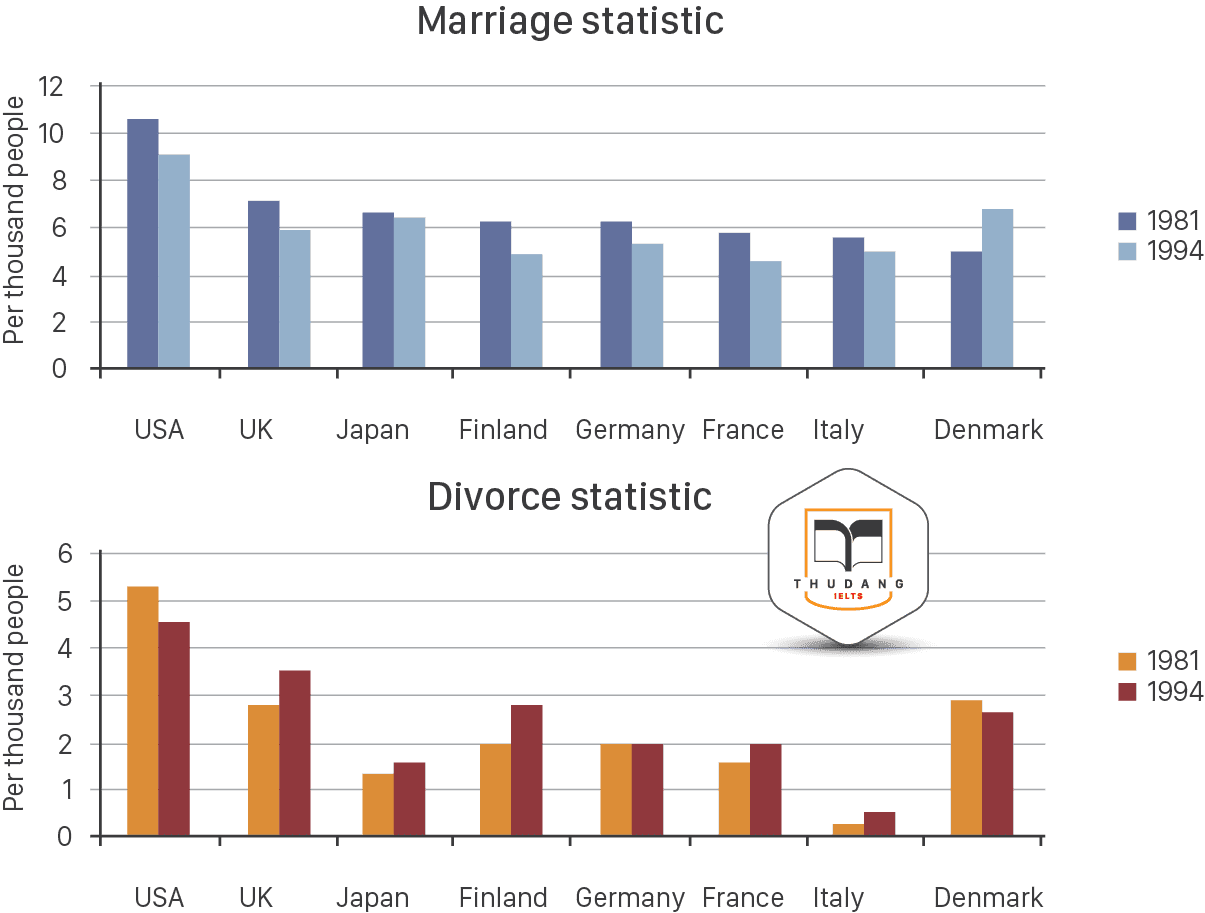
Sample answer: The bar graphs demonstrate the number of marriages and divorces in 9 different nations for the years 1981 and 1994. Overall, it is clear that with the exception of Denmark, the rate of marriages in all of these countries diminished over the surveyed period. Meanwhile, the figure of divorce experienced an increase in five out of nine nations. To begin with, the marriage rate in 1981 in the USA was by far the highest among the reported nine nations which was more than 10 per thousand. In other European countries, including United Kingdom, France, Finland, Denmark, Italy, the marriage rate was around 6 for each thousand. Denmark had the lowest rate of marriage in 1981 which was about 5 per thousand. After 15 years the marriage rate fell slightly in a majority of the given nations with the exception of Denmark with the rate rising by nearly 2 per thousand. Further analyzing the graph, it is noticeable from the divorce statistic that the highest rate of divorce rate was in the USA which was over 5 per thousand. The divorce rate in 1994 rose in comparison with that in 1981 in all of the nation’s apart from USA and Denmark. Italy had the lowest divorce rate among the given nations and there was no change in this rate for the given 2 years in Germany. |
9. The pie charts below show the average household expenditures in a country in 1950 and 2010. Summarise the information by selecting and reporting the main features, and make comparisons where relevant

Sample answer: The two pie charts depict the percentage of money spent on different goods and services of any nation in 1950 and 2010. Overall, it is clear that spending pattern changed almost completely over the given time frame. Housing was the biggest investment sector in 1950, however people spent most of their money on food in 2010. In 2010, the largest proportion of expenditure (34%) was on food whereas in 1950 this value was just 11.2%. There was a great difference in terms of the amount of money people spent on housing between the two years. In 1950, 72.1% of the total household budget went towards housing, compared to only 22% in 2010. It is interesting to note that funds allocated for education were roughly same in both the given years. Moreover health care was the sector which got least share over the given time period. Further analyzing, people had notably increased the amount of money spent on transportation between the two dates in which 14% of the total budget was disbursed in later year comparing to only 3.3% in the former year. In addition, the charts show a significant rise in the proportion of money spent on health care in 2010 compared to 1950. |
10. The pie charts below show electricity generation by source in New Zealand and Germany in 1980 and 2010. Summarize the information by selecting and reporting the main features, and make comparisons where relevant.
The pie charts below show electricity generation by source in New Zealand and Germany in 1980 and 2010. Summarize the information by selecting and reporting the main features, and make comparisons where relevant.
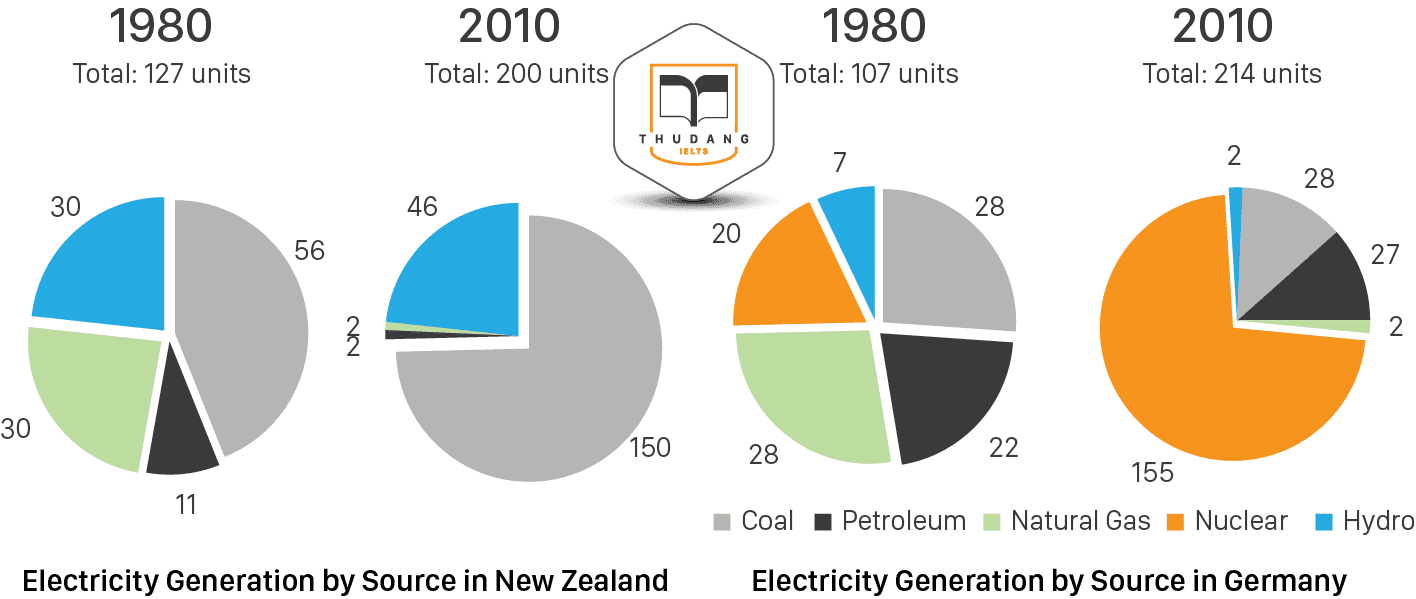
Sample answer: The given pie charts illustrate the changes in the generation of electricity by five main sources, namely coal, petroleum, natural gas, nuclear and hydro over a period of three decades in Germany and New Zealand. Overall , it is clear that there are some significant differences in the energy sources. By 2010 these two countries relied on different fuel sources, New Zealand mostly relied on coal and Germany on nuclear power. To begin with, in 1980 New Zealand used coal as the main electricity source (56 units) and the remainder was produced from natural gas, hydro power (each producing 30 units) and petroleum (which produced only 11 units). By 2010, coal had become the fuel for more than 75% of electricity produced and only hydro continued to be another significant source supplying approximately 20%. In contrast, Germany used coal as a source for only 28 units of electricity in 1980, which was matched by natural gas. The remaining 49 units were produced largely from petroleum and nuclear power, with hydro contributing only 7 units. But by 2010 nuclear power, which was not used at all in New Zealand, had developed into the main source, producing almost 75% of electricity, at 155 units, while coal and petroleum together produced only 55 units. Other sources were no longer significant. |
.png)
IELTS THƯ ĐẶNG CHÚC BẠN THI TỐT!
Thân mến,
IELTS THƯ ĐẶNG
 ĐĂNG KÝ KIỂM TRA ĐẦU VÀO - TƯ VẤN MIỄN PHÍ
ĐĂNG KÝ THI THỬ
.png) ĐĂNG KÝ KHOÁ LUYỆN ĐỀ VÀ GIẢI ĐỀ IELTS
ĐĂNG KÝ KHOÁ LUYỆN ĐỀ VÀ GIẢI ĐỀ IELTS
.png) ĐĂNG KÝ KHOÁ IELTS TIẾP THEO ( Dành cho học viên IELTS - Thư Đặng)
ĐĂNG KÝ KHOÁ IELTS TIẾP THEO ( Dành cho học viên IELTS - Thư Đặng)