


IELTS THƯ ĐẶNG- TRUNG TÂM LUYỆN THI IELTS UY TÍN, CHẤT LƯỢNG TẠI HÀ NỘI
Tham khảo các bài liên quan:
>>> Kinh nghiệm luyện thi IELTS
>>> Hướng dẫn làm bài thi IELTS
BÀI MẪU WRITING TASK 1 - Test 1 BAND 7.5 I CAMBRIDGE 16 I
Tài liệu luyện thi IELTS cực hot Cambridge 16 mới xuất bản, và qua bài viết này IELTS Thư Đặng giới thiệu cho các bạn 07 bài mẫu được xem xét và điểm dự kiến 7.5 IELTS.
WRITING |
You should spend about 20 minutes on this task.
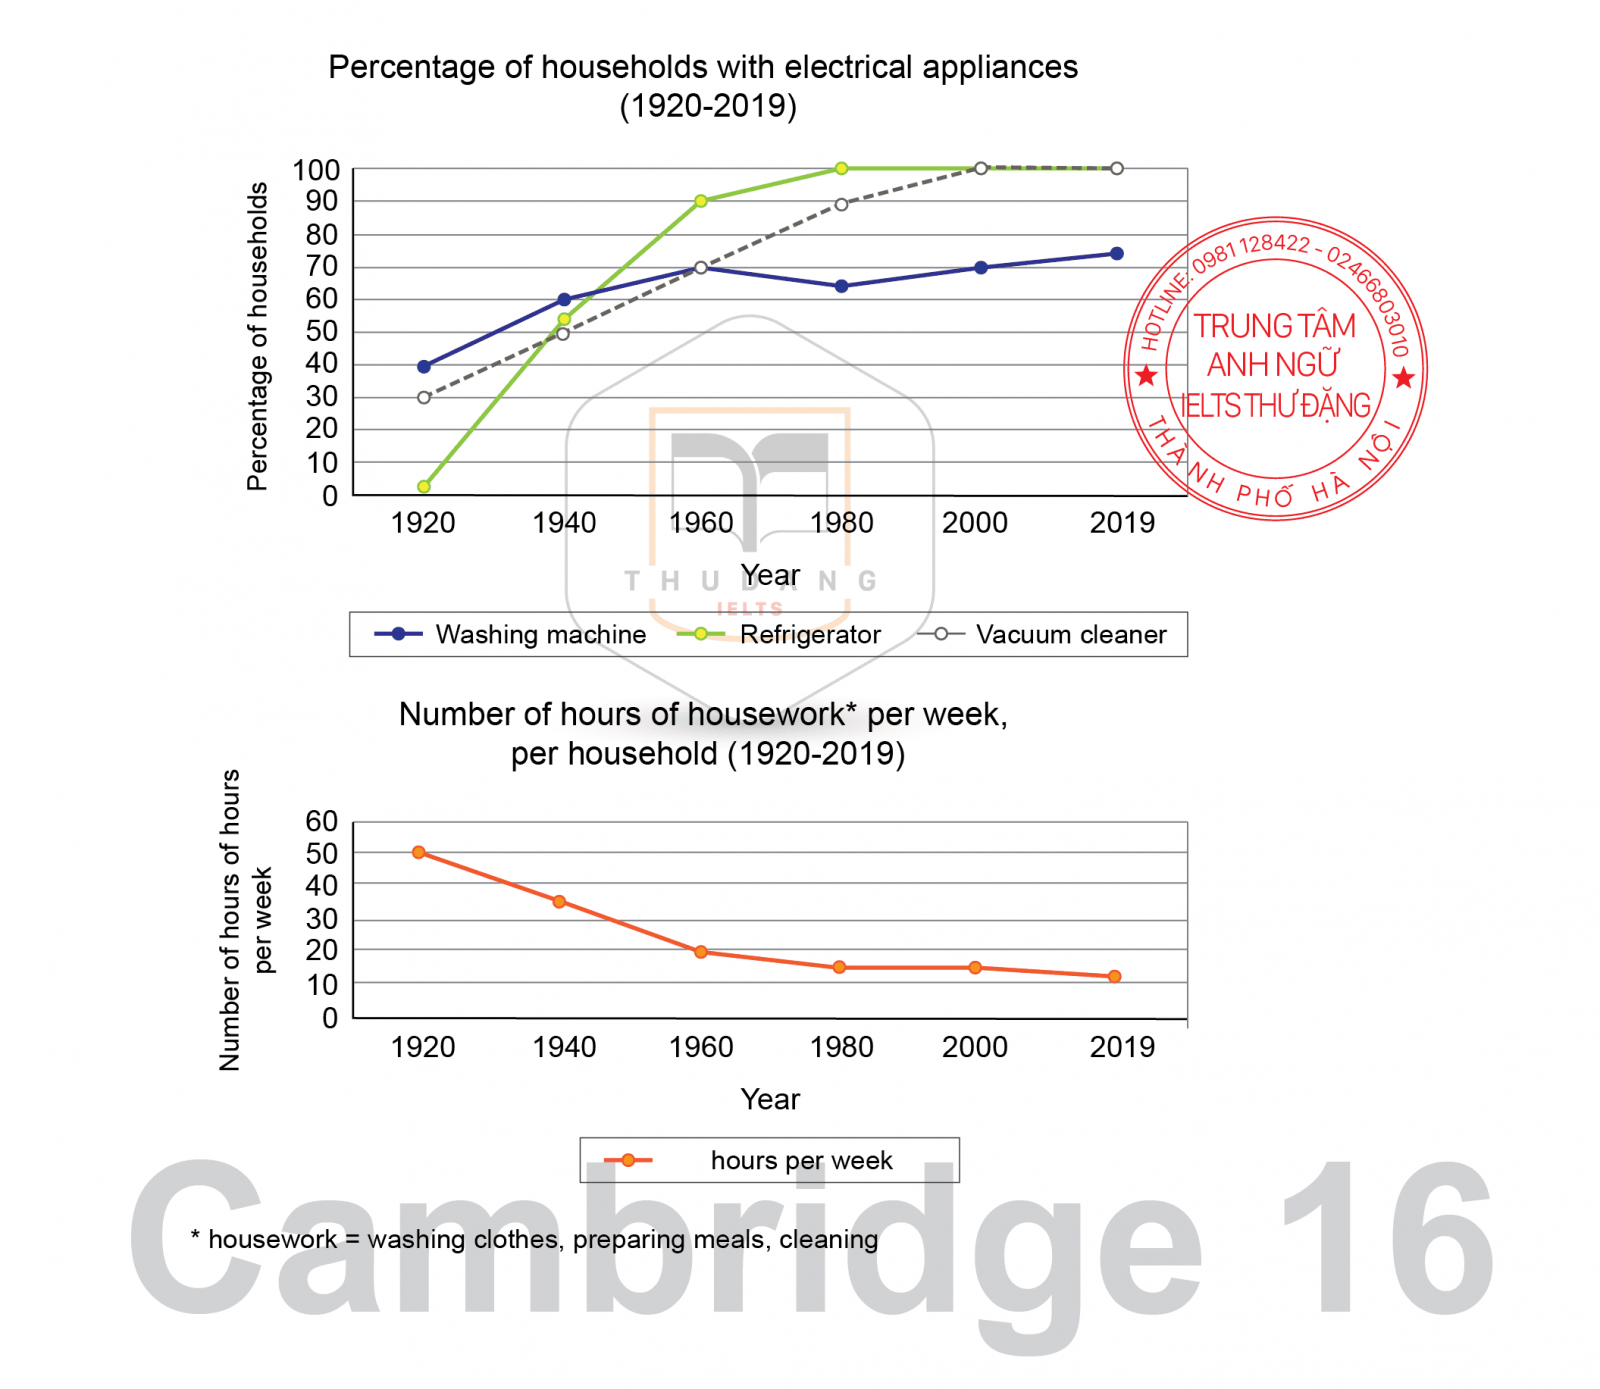
The charts below show the changes in ownership of electrical appliances and amount of time spent doing housework in households in one country between 1920 and 2019.
Summarise the information by selecting and reporting the main features, and make comparisons where relevant. |
Write at least 150 words.
Sample No 1
The charts below show the changes in ownership of electrical appliances and amount of time spent doing housework in households in one country between 1920 and 2019. The graphs illustrate the proportion of state of the art device’s usage such as, washing machine, refrigerator and vacuum cleaner, among households as well as the amount of time spending on using them in one particular country during one century.
Overall, the usage of all electrical appliances has increased during the period mentioned. However, the amount of time spent on cleaning up their homes every week has significantly declined during this period.
It ts evident that despite the fact that using the refrigerator was not common among households during the first time of survey, by the following years, it had been increased dramatically, until reached its peak at 100%, by 1980, after that remained in the same percentage by the rest of years. However, although the ratio of washing machine consumption was higher than the vacuum cleaner, about 10% higher, in 1920, after experiencing the same amount of usage in 1960, about 70%, the vacuum usage was surpassed, rising a full 100 percent, by 2000, the same level of washing machine percentage.
According to time- served on doing household chores, half of hours were consumed in the biginning year, however, it saw an increasingly drop until 40 years later, reaching to one fifth of time, then fluctuated approximately steadily at the rest of period.
Words: 241 |
Sample No 2
The charts below show the changes in ownership of electrical appliances and amount of time spent doing housework in households in one country between 1920 and 2019. Summarise the information by selecting and reporting the main features, and make comparisons where relevant.
Given are two line graphs depicting the proportions of families of the same nationality possessing three sorts of electrical apparatus, as well as the time devoted by these families, in hours per week (h/w), to household chores done by these appliances from 1920 to 2019.
What is conspicuous at a glance is that, despite a negligible decrease for washing machines, the number of families equipped with home appliances has increased throughout the span, which inversely matches with the length of time spent on carrying out tasks pertained to these devices. Regarding washing machine, the most prevalent device in 1920, the percentages of households employed it, having stood at 40 percent, rose moderately to just over 70 percent in 2019, with a significant climb by 1960 and a slight dip in 1980. Turning to vacuum cleaner users, however, the general trend was upwards; starting from 30 percent, exceeding that of washing machines in 1960, before hitting a peak at 100 percent in 2000 when it leveled off towards the end of the period. Similarly, refrigerator owners soared, with an abrupt rise from just over zero to 100 percent in 1980, when it remained stable from then onwards, while surpassing that of two other devices during less than a decade around 1940. Conversely, the country experienced a descending pattern in the number of hours spent on doing household works by these appliances on a weekly basis, with time declining sharply from 50h/w in 1920 to 20 h/w in 1960, followed by a steady drop to be halved.
Words: 297 |
Sample No 3
The first line chart compares the proportion of houses equipped with three electrical devices (washing machine, refrigerator, and vacuum cleaner) and the next one illustrates the weekly hours of utilizing them to do household activities, every twenty years between 1920 and 2019.
Overall, it can be seen that although the percentage of homes in which these three household electronics were adopted has experienced a considerable increase, there was a significant decrease in the number of hours using them doing housework over the provided period.
Among the given appliances, washing machine with a slight fluctuation between 1960 and 1980, had the least amount of increase, about 30% from 40% to 70%, rather than two other. In 1920, no households used refrigerator, while vacuum cleaner was found in approximately 40% homes. With a sharp growth in taking both, refrigerator became a necessary tool used by all people in 1980, compared to vacuum cleaner that reach the same situation of refrigerator in 2000.
With regards to the number of weekly hours of using mentioned tools to wash cloths, prepare meal, or clean the house, this figure witnessed a noticeable decline during the time interval. It decrease sharply from 50% in 1920 to about 20% in 1960. Over the rest of the period from 1960 to 2019, there was only around 10% reduction in hours. Words: 221 |
Sample No 4
While the first diagram illustrates how proportion are households with electrical appliances, namely washing machine, refrigerator and vacuum cleaner, changed, the second one shown is that the number of hours of housework, namely washing clothes, preparing meals and cleaning, during a week spent in households in a country between 1920 and 2019
Overall, although washing machine ranked first initially, it was over than by refrigerator and vacuum cleaner towards the end and the one letter ranked first during most of this period and the second letter saw a dramatic increase and peaked as high as the refrigerator. The number of housework hours peaked at the first time and experienced a slight decrease despite an initial rapid decline.
While the figure for washing machine ranked first at the first time in 1920 (40%), that of vacuum cleaner stood second by 10%. Both appliances saw a moderate increase in 1940 by 20% and reached 60% and 50%, respectively. After some fluctuation from 1960 until 1980, washing machine increased slightly at about 72c/o in 2019. However, the vacuum cleaner rose rapidly until 1980 at 90% and leveled off and picked (100c/o).
The figure for refrigerator experienced a dramatic increase until 1960 (90%), despite it had the lowest proportion of household at first, and that of rose moderately and level off in 1980 at 100%.
While the number of hours per week stood first in 1920 at 50 hours, during 40 years that of housework declined significantly, and reached 20hr in 1960. The figure for hours of housework dropped slightly in 1980 about 15% and maintained this level in 2019 despite a slight decrease.
Words: 270 |
Sample No 5
The line charts illustrate the percentage of households which had three kinds of appliances and the number of hours of housework in every household in one country during a period of 99 years. Overall, the percentages of washing machines, refrigerators, and vacuum cleaners used by households increased over the given period. However, the figure for hours of housework saw a decline during the same period. In addition, from 2000 onwards, the figure for the refrigerator was equal to that of the vacuum cleaner. In 1920, the percentage of households that owned vacuum cleaners stood at 30%, while that of refrigerators was lower at around 2%. From this year to 2019, the figures for vacuum cleaners and refrigerators grew rapidly by 70% and about 98%, respectively. Between 1920 and 1960, the proportion of washing machines rose from 40% to 70%, after which it fluctuated around 70% over the next 40 years. In the subsequent years, it experienced an increase of approximately 5%.
According to the second chart, the largest number of hours of the housework was spent in 1920, at 50.
From 1920 to 1980, there was a significant fall of roughly 35 in the figure for hours of housework, and over the next 20 years, it remained constant at 15 hours. However, in 2019, the figure for hours of housework declined to nearly 10.
Words: 224 |
Sample No 6
A glance at the provide provided graphs illustrates the quantity of electrical appliances including washing machine, refrigerator, and vacuum cleaner were benefited by households by percentage and even the time they spent per week to do their house chores in the period of ninety years from 1920 to 2019. Apparently, the use of electrical equipment experienced exponential growth among housewives, and also the majority of them budget negligible time for house works in comparison with the past.
Considering washing machine and vacuum cleaner, 40% and 30% of households used mentioned equipment in 1920 respectively whilst refrigerator allocated 0% to itself and it seem it was unfamiliar with housewives. In the next 20 years, refrigerator reached exponential growth among households since then it swelled to 55%. Simultaneously, the washing machine and vacuum cleaner followed similar patterns and rocketed to 40% and 60% respectively. Both refrigerator and vacuum cleaner rose dramatically to a pick of 100% in 1980 and 2000 in order. Otherwise, washing machine lost its reputation among households since its experienced fluctuation between 1940 and 1989 then reached approximately 60% in 1980. In the following years until 2019, although refrigerator and vacuum cleaner maintained the value of 100%, washing machine climbed slightly from 60% in 1980 to in the vicinity of 70% in 2019. Regarding the hours that each housewife budgeted for doing the house chores, it should be considered that by increasing the use of electrical appliances between 1920 to 1960, the majority of people spent fewer hours per week precisely, doing house works shrunk from 50% in 1920 to 20% in the 60 following years. Moreover, the hours were budgeted for house chores dropped to 10% in 2019.
Based on the illustrated figures, it can be concluded that by raising individual`s dependency to the mentioned electrical equipment, they spent negligible time to carry out their tasks and consequently these applicable equipment shoulders their responsibilities more efficiently.
Words: 318 |
Sample No 7
The given line graphs provide information on the percentage of households that owned three types of electrical appliances in a particular country from1920 to 2019, and the number of hours per week these families spent on housework is illustrated over the same period.
In general, there had been an upward trend in the percentage of families who possessed domestic appliances. However, the increase in the ownership of refrigerator was much more significant than that for washing machine and vacuum cleaner. The trend for the number of time households spent using these devices was downward during the period.
In 1920, almost no household had a refrigerator, while 30 % and 40% of them owned a vacuum cleaner and a washing machine respectively. By 1960, the number of families with a refrigerator in their house had risen dramatically to 90%, 20% higher than those who had a washing machine or a vacuum cleaner in the same year.
By the end of the period, all households (100%) in the country had possessed refrigerator and vacuum cleaner. In comparison, the ownership of washing machine peaked at just over 70% in 2019 after a slight fall of 10% between 1960 and 1980.
Regarding the number of hours of housework done by one family every week, at the beginning of the period, 50 hours were spent working with these appliances. This figure decreased to approximately 15% in 1980, when percentages remained stable for 20 years. After that, a slight decline of 5% was witnessed.
Words: 248 |
IELTS - Thư Đặng Tổng hợp!
![]()
Trân trọng cảm ơn các bạn!
Ngoài ra các bạn có thể tham khảo thêm rất nhiều nguồn tài liệu khác ở các thư mục của Website:
.png)
IELTS THƯ ĐẶNG CHÚC BẠN THI TỐT!
Thân mến,
IELTS THƯ ĐẶNG
 ĐĂNG KÝ KIỂM TRA ĐẦU VÀO - TƯ VẤN MIỄN PHÍ